Background
Antioxidants can potentially alter the progression of lower urinary tract symptoms (LUTS) through anti-inflammatory mechanisms.
Objective
To determine if dietary antioxidants are associated with reduced likelihood of LUTS progression or increased likelihood of LUTS remission in untreated elderly men.
Design, setting, and participants
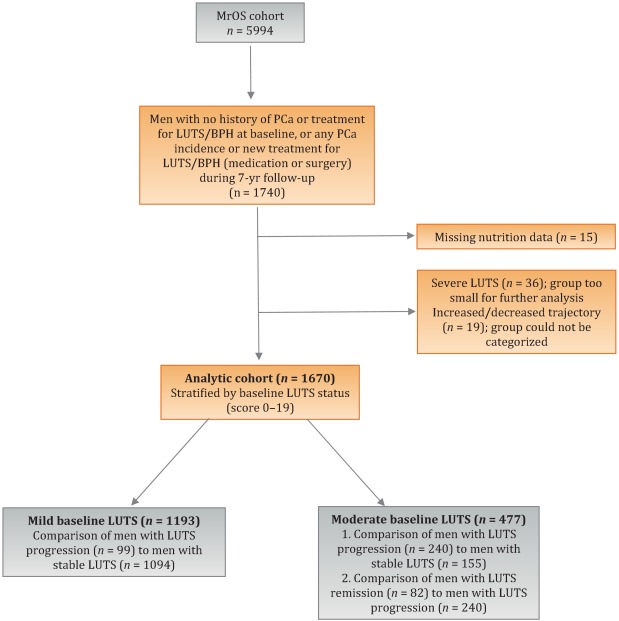
A prospective cohort study of 1670 US men aged 65–100 yr.
Outcome measurements and statistical analysis
Baseline variables included the American Urological Association Symptom Index, dietary intake assessed via a 69-item Block food frequency questionnaire (FFQ), demographics, lifestyle characteristics, quality of life (SF-12), and medication use. LUTS was assessed at four time points over a mean ± standard deviation period of 6.9 ± 0.4 yr. Group-based trajectory modeling was performed for men without prostate cancer who did not undergo LUTS treatment with medication or surgery during follow-up (n = 1670). Analyses were stratified by LUTS symptoms at baseline. For men with mild baseline LUTS, we examined the likelihood of LUTS progression relative to LUTS stability. For men with moderate baseline LUTS, we analyzed the likelihood of both LUTS progression relative to LUTS stability and LUTS remission relative to progression. Odds ratios and 95% confidence intervals were estimated for quartiles of daily antioxidant intake using multivariable logistic regression.
Results and limitations
None of the dietary antioxidants (vitamin C, vitamin E, β-carotene, α-carotene, β-cryptoxanthin, lycopene, lutein/zeaxanthin) was associated with a lower probability of LUTS progression or LUTS remission. The study was limited by use of the brief Block FFQ, which contains only 69 food items and may have biased results toward the null hypothesis because of nondifferential misclassification.
Conclusions
In this large cohort of US men, there were no significant associations between multiple dietary antioxidants and LUTS progression or remission over 7 yr.
Patient summary
In a large cohort of elderly men, there were no significant longitudinal associations between multiple dietary antioxidants and lower urinary tract symptoms (LUTS). Our data suggest that dietary antioxidant consumption may not influence the natural history of LUTS in older men.
Lower urinary tract symptoms (LUTS) are common among elderly men and have substantial global adverse effects on male health [1] and [2]. LUTS have been associated with higher mortality and morbidity [3] and billions of US dollars in annual health care expenditure [4] . Since obesity and exercise have been associated with higher and lower risks of LUTS, respectively [5] and [6], lifestyle changes might potentially prevent LUTS progression. Dietary constituents, especially antioxidants, are candidate lifestyle targets for LUTS prevention. Since antioxidants have potent anti-inflammatory properties, an increase in dietary antioxidant consumption might decrease LUTS via modulation of inflammatory pathways involved in the pathogenesis of LUTS and benign prostatic hyperplasia (BPH) [7] .
At least three studies have reported inverse associations between LUTS or BPH and consumption of antioxidants or foods rich in antioxidants, including β-carotene [8], [9], and [10], lutein [8] , lycopene [9] and [10], total carotenoids [10] , vitamin C [8] , vitamin E and selenium [9] , vegetables [11], [12], [13], and [14], and fruits [13] and [15]. Higher consumption of fruits and vegetables (including those rich in β-carotene and lycopene) has also been associated with a lower risk of BPH incidence [8] and [11].
Since most of the prior studies were cross-sectional, temporal associations between dietary antioxidants and LUTS remain unclear. Moreover, to the nest of our knowledge, no studies have examined potential associations between dietary antioxidants and the risk of LUTS progression in elderly men. Given the high prevalence of LUTS in this population [2] , the development of relatively straightforward dietary interventions to prevent LUTS progression in elderly men may substantially inform the clinical care of men with LUTS. Therefore, we examined the association between baseline dietary antioxidant intake and subsequent LUTS progression over a 7-yr period in elderly men. We hypothesized that higher baseline consumption of dietary antioxidants is associated with a lower probability of LUTS progression.
We previously reported on descriptive AUA-SI data for this analytic cohort [26] . Among men with mild baseline symptoms, men with LUTS progression had slightly lower physical activity and were more likely to report mobility limitations and a history of dizziness and non–prostate cancer when compared to men with stable LUTS. (As mentioned earlier, those with a history of prostate cancer were excluded from analyses.) In those with moderate baseline symptoms, men with LUTS progression were marginally younger, had a significantly lower SF-12 mental score, were less likely to live alone, had lower overall energy intake, and were more likely to suffer from depression and back pain when compared to men with stable LUTS. By contrast, men with LUTS remission had a slightly higher SF-12 mental score (closer to those with stable symptoms); had less education; were less likely to have a history of problem drinking, hypertension, or angina; were less likely to use diuretics; and consumed less caffeine when compared to men with LUTS progression ( Table 1 ).
Table 1 Baseline characteristics for the study population
| Progression | Remission | ||||||||
|---|---|---|---|---|---|---|---|---|---|
| Mild LUTS | Moderate LUTS | Moderate LUTS | |||||||
| Stable (n = 1094) |
Progression (n = 99) |
p value a | Stable (n = 155) |
Progression (n = 240) |
p value a | Progression (n = 240) |
Remission (n = 82) |
p value a | |
| Mean age, yr (SD) | 71.2 (4.8) | 71.4 (4.8) | 0.71 | 72.4 (4.8) | 71.4 (4.9) | 0.06 | 71.4 (4.9) | 72.3 (4.9) | 0.17 |
| Mean BMI, kg/m2 (SD) | 27.2 (3.6) | 27.4 (3.5) | 0.72 | 27.3 (3.6) | 27.5 (3.8) | 0.57 | 27.5 (3.8) | 26.9 (3.8) | 0.23 |
| Mean PASE (SD) | 163 (70) | 149 (64) | 0.05 | 152 (69) | 151 (59) | 0.93 | 151 (59) | 147 (60) | 0.55 |
| Mean SF-12 physical score (SD) | 52.4 (7.3) | 50.6 (8.8) | 0.03 | 50.5 (8.2) | 50.1 (9.0) | 0.67 | 50.1 (9.0) | 48.6 (10.1) | 0.18 |
| Mean SF-12 mental score (SD) | 56.9 (5.4) | 55.9 (7.0) | 0.09 | 56.6 (6.4) | 54.6 (7.1) | 0.006 | 54.6 (7.1) | 56.2 (6.1) | 0.07 |
| Race, n (%) | |||||||||
| Non-Caucasian | 105 (10) | 13 (13) | 0.26 | 17 (11) | 16 (7) | 0.13 | 16 (7) | 7 (9) | 0.57 |
| Caucasian | 989 (90) | 86 (87) | 138 (89) | 224 (93) | 224 (93) | 75 (91) | |||
| BMI, n (%) | |||||||||
| Normal | 304 (28) | 19 (19) | 0.07 | 43 (28) | 58 (24) | 0.43 | 58 (24) | 27 (33) | 0.12 |
| Overweight/obese | 790 (72) | 80 (81) | 112 (72) | 182 (76) | 182 (76) | 55 (67) | |||
| Live alone, n (%) | 125 (11) | 17 (17) | 0.09 | 24 (15) | 21 (9) | 0.04 | 21 (9) | 6 (7) | 0.69 |
| High school education or less, n (%) | 493 (45) | 43 (43) | 0.75 | 67 (43) | 103 (43) | 0.95 | 103 (43) | 46 (56) | 0.04 |
| Self-rated health, n (%) | |||||||||
| Excellent | 488 (45) | 45 (45) | 0.49 | 59 (38) | 84 (35) | 0.69 | 84 (35) | 30 (37) | 0.84 |
| Good | 547 (46) | 46 (46) | 81 (52) | 127 (53) | 127 (53) | 44 (54) | |||
| Fair/poor/very poor | 59 (5) | 8 (8) | 15 (10) | 29 (12) | 29 (12) | 8 (10) | |||
| Mobility limitations, n (%) | 65 (6) | 13 (13) | 0.006 | 13 (8) | 20 (8) | 0.99 | 20 (8) | 9 (11) | 0.47 |
| Walk for exercise, n (%) | 578 (53) | 42 (42) | 0.05 | 80 (52) | 115 (48) | 0.47 | 115 (48) | 45 (55) | 0.28 |
| Alcohol consumption, n (%) | |||||||||
| Never | 322 (29) | 33 (33) | 0.71 | 53 (34) | 80 (33) | 0.95 | 80 (33) | 29 (35) | 0.92 |
| 1–14 drinks/wk | 710 (65) | 61 (62) | 90 (58) | 143 (60) | 143 (60) | 48 (59) | |||
| >14 drinks/wk | 62 (6) | 5 (5) | 12 (8) | 17 (7) | 17 (7) | 5 (6) | |||
| History of problem drinking | 150 (15) | 19 (20) | 0.17 | 35 (24) | 55 (25) | 0.87 | 55 (25) | 10 (13) | 0.03 |
| Smoking, n (%) | |||||||||
| Never | 432 (40) | 40 (40) | 0.86 | 60 (39) | 86 (36) | 0.56 | 86 (36) | 34 (41) | 0.36 |
| Ever | 661 (60) | 59 (60) | 95 (61) | 154 (64) | 154 (64) | 48 (59) | |||
| Medical conditions, n (%) | |||||||||
| Depression b | 55 (5) | 8 (8) | 0.19 | 6 (4) | 28 (12) | 0.007 | 28 (12) | 6 (7) | 0.27 |
| Diabetes | 85 (8) | 10 (10) | 0.41 | 21 (14) | 22 (9) | 0.17 | 22 (9) | 4 (5) | 0.25* |
| Dizziness | 170 (16) | 23 (23) | 0.05 | 36 (23) | 65 (27) | 0.39 | 65 (27) | 21 (26) | 0.79 |
| Cancer | 164 (15) | 23 (23) | 0.03 | 32 (21) | 49 (20 | 0.96 | 49 (20) | 16 (20) | 0.86 |
| Hypertension | 372 (34) | 42 (42) | 0.09 | 52 (34) | 102 (43) | 0.07 | 102 (43) | 25 (30) | 0.05 |
| Angina | 120 (11) | 8 (8) | 0.37 | 19 (12) | 37 (15) | 0.38 | 37 (15) | 6 (7) | 0.06 |
| Heart disease | 182 (16) | 17 (17) | 0.89 | 42 (27) | 54 (23) | 0.30 | 54 (23) | 16 (20) | 0.57 |
| Back pain | 650 (59) | 68 (69) | 0.07 | 99 (64) | 177 (74) | 0.04 | 177 (74) | 59 (72) | 0.75 |
| Medication use, n (%) c | |||||||||
| Diuretics | 127 (12) | 14 (14) | 0.45 | 18 (12) | 42 (18) | 0.11 | 42 (18) | 7 (9) | 0.05 |
| CNS medications | 63 (6) | 8 (8) | 0.35 | 12 (8) | 25 (10) | 0.37 | 25 (10) | 14 (17) | 0.11 |
| Select dietary factors | |||||||||
| Median energy intake, kcal (IQR) | 1498 (714) | 1471 (795) | 0.94 | 1691 (804) | 1520 (691) | 0.04 | 1520 (691) | 1413 (665) | 0.27 |
| Median caffeine intake, (IQR) | 150 (373) | 105 (371) | 0.93 | 177 (502) | 180 (422) | 0.76 | 180 (422) | 110 (339) | 0.06 |
| Regular multivitamin consumption, n (%) | 577 (54) | 46 (50) | 0.43 | 74 (49) | 123 (52) | 0.51 | 123 (52) | 39 (49) | 0.67 |
a We computed p values using Student's t-test, a χ2 test, or * Fisher's exact test, as appropriate.
b Depression was defined as SF-12 mental component score of ≤45.
c Men for whom medication data were missing (n = 24) coded as nonusers.
LUTS = lower urinary tract symptoms; SD = standard deviation; BMI = body mass index; PASE = Physical Activity Scale for the Elderly; SF = short form; CNS = central nervous system.
Among men with mild baseline symptoms, LUTS progression was not associated with the antioxidants vitamin C, vitamin E, β-carotene, α-carotene, β-cryptoxanthin, lycopene, and lutein/zeaxanthin when comparing the highest quartile (Q4) to the lowest quartile (Q1) for intake ( Table 2 ).
Table 2 Association between micronutrient intake and LUTS progression for men with mild baseline LUTS (n = 1193) a
| Nutrient intake quartile | p value for trend | ||||
|---|---|---|---|---|---|
| Q1 | Q2 | Q3 | Q4 | ||
| Vitamin C from food | |||||
| Median intake, mg/d (IQR) | 48 (25) | 91 (23) | 135 (19) | 192 (67) | |
| Men with remission, n (%) | 29 (10) | 27 (8) | 24 (8) | 19 (7) | |
| OR (95% CI), kcal adjustment | Reference | 0.82 (0.47–1.45) | 0.79 (0.44–1.44) | 0.65 (0.34–1.24) | 0.20 |
| OR (95% CI), multivariable adjustment | Reference | 0.82 (0.46–1.45) | 0.78 (0.43–1.43) | 0.65 (0.33–1.25) | 0.20 |
| Total vitamin C | |||||
| Median intake, mg/d (IQR) | 86 (46) | 173 (54) | 438 (297) | 1125 (603) | |
| Men with remission, n (%) | 27 (9) | 21 (7) | 23 (8) | 28 (9) | |
| OR (95% CI), kcal adjustment | Reference | 0.75 (0.41–1.36) | 0.78 (0.43–1.40) | 0.99 (0.56–1.74) | 0.61 |
| OR (95% CI), multivariable adjustment | Reference | 0.78 (0.42–1.43) | 0.80 (0.44–1.45) | 1.02 (0.58–1.80) | 0.59 |
| Vitamin E from food | |||||
| Median intake, mg α-TE/d (IQR) | 5 (2) | 7 (1) | 10 (2) | 14 (5) | |
| Men with remission, n (%) | 25 (8) | 27 (9) | 23 (8) | 24 (8) | |
| OR (95% CI), kcal adjustment | Reference | 1.38 (0.72–2.63) | 1.16 (0.55–2.46) | 1.10 (0.48–2.52) | 0.93 |
| OR (95% CI), multivariable adjustment | Reference | 1.47 (0.76–2.83) | 1.25 (0.59–2.67) | 1.19 (0.52–2.74) | 0.96 |
| Total vitamin E | |||||
| Median intake, mg α-TE/d (IQR) | 7 (4) | 28 (8) | 276 (96) | 347 (265) | |
| Men with remission, n (%) | 24 (8) | 26 (9) | 23 (7) | 26 (9) | |
| OR (95% CI), kcal adjustment | Reference | 1.07 (0.60–1.92) | 0.84 (0.46–1.52) | 1.09 (0.60–1.96) | 0.82 |
| OR (95% CI), multivariable adjustment | Reference | 1.10 (0.60–1.98) | 0.87 (0.47–1.59) | 1.15 (0.63–2.08) | 0.95 |
| β-Carotene from food | |||||
| Median intake, μg/d (IQR) | 1165 (572) | 2179 (477) | 3588 (839) | 6722 (3586) | |
| Men with remission, n (%) | 29 (10) | 27 (9) | 24 (8) | 19 (6) | |
| OR (95% CI), kcal adjustment | Reference | 0.92 (0.52–1.62) | 0.75 (0.41–1.36) | 0.63 (0.33–1.20) | 0.14 |
| OR (95% CI), multivariable adjustment | Reference | 0.95 (0.54–1.68) | 0.79 (0.43–1.45) | 0.63 (0.33–1.22) | 0.14 |
| Total β-carotene | |||||
| Median intake, μg/d (IQR) | 1670 (817) | 3077 (703) | 4884 (1233) | 9762 (10152) | |
| Men with remission, n (%) | 33 (11) | 23 (8) | 24 (7) | 19 (7) | |
| OR (95% CI), kcal adjustment | Reference | 0.65 (0.37–1.15) | 0.62 (0.35–1.11) | 0.54 (0.29–1.00) | 0.10 |
| OR (95% CI), multivariable adjustment | Reference | 0.72 (0.40–1.27) | 0.65 (0.36–1.16) | 0.56 (0.30–1.05) | 0.11 |
| α-Carotene | |||||
| Median intake, μg/d (IQR) | 178 (125) | 394 (174) | 732 (3367) | 1779 (1157) | |
| Men with remission, n (%) | 32 (11) | 25 (8) | 22 (7) | 20 (7) | |
| OR (95% CI), kcal adjustment | Reference | 0.72 (0.41–1.26) | 0.59 (0.32–1.06) | 0.62 (0.33–1.16) | 0.23 |
| OR (95% CI), multivariable adjustment | Reference | 0.77 (0.44–1.35) | 0.65 (0.36–1.18) | 0.64 (0.34–1.21) | 0.25 |
| β-Cryptoxanthin | |||||
| Median intake, μg/d (IQR) | 23 (20) | 88 (51) | 202 (68) | 287 (96) | |
| Men with remission, n (%) | 26 (9) | 30 (9) | 23 (8) | 20 (7) | |
| OR (95% CI), kcal adjustment | Reference | 1.02 (0.59–1.78) | 0.87 (0.48–1.57) | 0.72 (0.39–1.34) | 0.23 |
| OR (95% CI), multivariable adjustment | Reference | 1.06 (0.61–1.86) | 0.87 (0.48–1.58) | 0.70 (0.38–1.31) | 0.18 |
| Lycopene | |||||
| Median intake, μg/d (IQR) | 1080 (533) | 2162 (598) | 3651 (852) | 7565 (4993) | |
| Men with remission, n (%) | 22 (7) | 25 (8) | 31 (11) | 21 (7) | |
| OR (95% CI), kcal adjustment | Reference | 1.11 (0.61–2.03) | 1.53 (0.84–2.79) | 0.98 (0.50–1.91) | 0.81 |
| OR (95% CI), multivariable adjustment | Reference | 1.16 (0.63–2.13) | 1.52 (0.83–2.79) | 1.03 (0.53–2.02) | 0.91 |
| Lutein and zeaxanthin | |||||
| Median intake, μg/d (IQR) | 546 (272) | 994 (266) | 1593 (425) | 3168 (1906) | |
| Men with remission, n (%) | 26 (9) | 25 (8) | 25 (9) | 23 (7) | |
| OR (95% CI), kcal adjustment | Reference | 0.94 (0.53–1.69) | 0.99 (0.55–1.80) | 0.83 (0.44–1.54) | 0.55 |
| OR (95% CI), multivariable adjustment | Reference | 0.92 (0.51–1.66) | 1.01 (0.56–1.85) | 0.86 (0.46–1.61) | 0.67 |
a Supplemental estimates for carotenoids other than β-carotene were not available. The multivariable model was adjusted for energy (kcal quartiles), short-form 12 mental score (<50, 50–54, ≥55), mobility limitations (Y/N), and history of non–prostate cancer (those with prostate cancer were excluded from the analysis). Statistical significance was set at p = 0.005 after Bonferroni correction.
LUTS = lower urinary tract symptoms; IQR = interquartile range; OR = odds ratio; CI = confidence interval; α-TE = α-tocopherol equivalents.
Among men with moderate baseline symptoms, higher antioxidant intake was similarly not associated with a lower likelihood of LUTS progression ( Table 3 ). In analyses of LUTS remission relative to LUTS progression ( Table 4 ), higher lycopene intake was associated with a lower likelihood of LUTS remission after adjustment for energy intake, history of problem drinking, angina, and educational level (OR 0.37, 95% CI 0.16–0.82 for Q4 vs Q1; p = 0.04 for trend). However, this association was no longer statistically significant after adjustment for multiple comparisons.
Table 3 Association between micronutrient intake and LUTS progression for men with moderate baseline LUTS (n = 395) a
| Nutrient intake quartile | p value for trend | ||||
|---|---|---|---|---|---|
| Q1 | Q2 | Q3 | Q4 | ||
| Vitamin C from food | |||||
| Median intake, mg/d (IQR) | 51 (19) | 96 (18) | 134 (18) | 187 (60) | |
| Men with remission, n (%) | 68 (71) | 53 (55) | 73 (62) | 46 (54) | |
| OR (95% CI), kcal adjustment | Reference | 0.51 (0.28–0.94) | 0.71 (0.39–1.29) | 0.55 (0.28–1.05) | 0.17 |
| OR (95% CI), multivariable adjustment | Reference | 0.58 (0.31–1.07) | 0.81 (0.44–1.51) | 0.66 (0.34–1.29) | 0.43 |
| Total vitamin C | |||||
| Median intake, mg/d (IQR) | 95 (50) | 169 (49) | 421 (307) | 1105 (579) | |
| Men with remission, n (%) | 66 (61) | 66 (61) | 59 (57) | 49 (67) | |
| OR (95% CI), kcal adjustment | Reference | 1.08 (0.62–1.87) | 0.94 (0.54–1.64) | 1.41 (0.75–2.66) | 0.29 |
| OR (95% CI), multivariable adjustment | Reference | 1.27 (0.72–2.24) | 1.01 (0.57–1.80) | 1.82 (0.95–3.49) | 0.10 |
| Vitamin E from food | |||||
| Median intake, mg α-TE/d (IQR) | 5 (2) | 7 (1) | 10 (2) | 15 (8) | |
| Men with remission, n (%) | 55 (64) | 69 (68) | 63 (61) | 53 (51) | |
| OR (95% CI), kcal adjustment | Reference | 1.17 (0.59–2.32) | 0.93 (0.44–1.96) | 0.72 (0.31–1.64) | 0.25 |
| OR (95% CI), multivariable adjustment | Reference | 1.25 (0.62–2.49) | 1.01 (0.48–2.17) | 0.82 (0.35–1.93) | 0.42 |
| Total vitamin E | |||||
| Median intake, mg α-TE/d (IQR) | 8 (4) | 28 (9) | 273 (124) | 309 (263) | |
| Men with remission, n (%) | 62 (60) | 57 (56) | 69 (63) | 52 (66) | |
| OR (95% CI), kcal adjustment | Reference | 0.97 (0.55–1.70) | 1.16 (0.66–2.03) | 1.44 (0.77–2.69) | 0.19 |
| OR (95% CI), multivariable adjustment | Reference | 0.96 (0.54–1.72) | 1.25 (0.71–2.21) | 1.54 (0.82–2.91) | 0.11 |
| β-Carotene from food | |||||
| Median intake, μg/d (IQR) | 1190 (622) | 2240 (587) | 3564 (761) | 6643 (3484) | |
| Men with remission, n (%) | 67 (66) | 64 (59) | 53 (56) | 56 (62) | |
| OR (95% CI), kcal adjustment | Reference | 0.81 (0.45–1.46) | 0.73 (0.40–1.34) | 1.10 (0.57–2.12) | 0.53 |
| OR (95% CI), multivariable adjustment | Reference | 0.78 (0.43–1.41) | 0.81 (0.44–1.51) | 1.17 (0.60–2.30) | 0.36 |
| Total β-carotene | |||||
| Median intake, μg/d (IQR) | 1671 (706) | 2934 (807) | 4724 (1007) | 9500 (7972) | |
| Men with remission, n (%) | 66 (65) | 57 (55) | 67 (61) | 50 (63) | |
| OR (95% CI), kcal adjustment | Reference | 0.66 (0.37–1.17) | 0.95 (0.53–1.69) | 1.10 (0.58–2.10) | 0.39 |
| OR (95% CI), multivariable adjustment | Reference | 0.64 (0.35–1.14) | 1.04 (0.57–1.88) | 1.21 (0.63–2.34) | 0.23 |
| α-Carotene | |||||
| Median intake, μg/d (IQR) | 184 (122) | 371 (179) | 719 (393) | 1700 (1262) | |
| Men with remission, n (%) | 60 (55) | 68 (65) | 61 (62) | 51 (61) | |
| OR (95% CI), kcal adjustment | Reference | 1.57 (0.89–2.75) | 1.60 (0.89–2.87) | 1.64 (0.88–3.05) | 0.25 |
| OR (95% CI), multivariable adjustment | Reference | 1.74 (0.98–3.10) | 1.78 (0.97–3.25) | 1.90 (1.00–3.59) | 0.14 |
| β-Cryptoxanthin | |||||
| Median intake, μg/d (IQR) | 25 (21) | 97 (55) | 204 (66) | 295 (65) | |
| Men with remission, n (%) | 71 (68) | 56 (63) | 58 (54) | 55 (59) | |
| OR (95% CI), kcal adjustment | Reference | 0.80 (0.44–1.45) | 0.54 (0.31–0.95) | 0.71 (0.39–1.27) | 0.12 |
| OR (95% CI), multivariable adjustment | Reference | 0.85 (0.46–1.56) | 0.61 (0.34–1.08) | 0.83 (0.45–1.51) | 0.33 |
| Lycopene | |||||
| Median intake, μg/d (IQR) | 1076 (556) | 2214 (702) | 3685 (753) | 6565 (5098) | |
| Men with remission, n (%) | 50 (62) | 69 (62) | 57 (59) | 64 (60) | |
| OR (95% CI), kcal adjustment | Reference | 1.03 (0.57–1.88) | 1.01 (0.54–1.89) | 1.14 (0.61–2.13) | 0.66 |
| OR (95% CI), multivariable adjustment | Reference | 1.17 (0.63–2.17) | 1.09 (0.58–2.08) | 1.19 (0.63–2.25) | 0.71 |
| Lutein and zeaxanthin | |||||
| Median intake, μg/d (IQR) | 546 (263) | 945 (261) | 1581 (425) | 3147 (1323) | |
| Men with remission, n (%) | 67 (69) | 60 (61) | 60 (57) | 53 (56) | |
| OR (95% CI), kcal adjustment | Reference | 0.73 (0.40–1.33) | 0.62 (0.34–1.12) | 0.64 (0.34–1.19) | 0.24 |
| OR (95% CI), multivariable adjustment | Reference | 0.69 (0.38–1.28) | 0.68 (0.37–1.26) | 0.69 (0.36–1.30) | 0.41 |
a Supplemental estimates for carotenoids other than β-carotene were not available. The multivariable model was adjusted for energy (kcal quartiles), short-form 12 mental score (<50, 50–54, ≥55), and history of hypertension (Y/N). Statistical significance was set at p = 0.005 after Bonferroni correction.
LUTS = lower urinary tract symptoms; IQR = interquartile range; OR = odds ratio; CI = confidence interval; α-TE = α-tocopherol equivalents.
Table 4 Association between micronutrient intake and remission of lower urinary tract symptoms (n = 322) a
| Nutrient intake quartile | p value for trend | ||||
|---|---|---|---|---|---|
| Q1 | Q2 | Q3 | Q4 | ||
| Vitamin C from food | |||||
| Median intake, mg/d (IQR) | 48 (21) | 93 (18) | 134 (20) | 187 (67) | |
| Men with remission, n (%) | 28 (29) | 25 (32) | 19 (21) | 10 (18) | |
| OR (95% CI), kcal adjustment | Reference | 1.20 (0.61–2.33) | 0.67 (0.34–1.34) | 0.58 (0.24–1.39) | 0.11 |
| OR (95% CI), multivariable adjustment | Reference | 1.31 (0.66–2.62) | 0.75 (0.36–1.56) | 0.58 (0.24–1.42) | 0.14 |
| Total vitamin C | |||||
| Median intake, mg/d (IQR) | 90 (56) | 169 (51) | 367 (312) | 1081 (540) | |
| Men with remission, n (%) | 30 (31) | 15 (19) | 20 (25) | 17 (26) | |
| OR (95% CI), kcal adjustment | Reference | 0.53 (0.26–1.09) | 0.77 (0.39–1.51) | 0.80 (0.39–1.62) | 0.98 |
| OR (95% CI), multivariable adjustment | Reference | 0.52 (0.24–1.10) | 0.81 (0.40–1.63) | 0.81 (0.39–1.70) | 0.92 |
| Vitamin E from food | |||||
| Median intake, mg α-TE/d (IQR) | 5 (2) | 7 (1) | 10 (2) | 15 (7) | |
| Men with remission, n (%) | 24 (30) | 23 (25) | 20 (24) | 15 (22) | |
| OR (95% CI), kcal adjustment | Reference | 0.82 (0.40–1.71) | 0.80 (0.35–1.85) | 0.67 (0.25–1.79) | 0.46 |
| OR (95% CI), multivariable adjustment | Reference | 0.95 (0.44–2.03) | 0.90 (0.38–2.14) | 0.80 (0.29–2.22) | 0.66 |
| Total vitamin E | |||||
| Median intake, mg α-TE/d (IQR) | 7 (4) | 27 (9) | 273 (130) | 309 (241) | |
| Men with remission, n (%) | 21 (25) | 23 (29) | 23 (25) | 15 (22) | |
| OR (95% CI), kcal adjustment | Reference | 1.21 (0.59–2.49) | 0.97 (0.48–1.94) | 0.92 (0.42–2.01) | 0.57 |
| OR (95% CI), multivariable adjustment | Reference | 1.19 (0.57–2.50) | 0.94 (0.46–1.92) | 0.91 (0.41–2.03) | 0.53 |
| β-Carotene from food | |||||
| Median intake, μg/d (IQR) | 1176 (575) | 2144 (579) | 3564 (848) | 7177 (3778) | |
| Men with remission, n (%) | 22 (25) | 21 (25) | 18 (25) | 21 (27) | |
| OR (95% CI), kcal adjustment | Reference | 1.09 (0.54–2.22) | 1.22 (0.57–2.62) | 1.37 (0.63–2.98) | 0.42 |
| OR (95% CI), multivariable adjustment | Reference | 1.15 (0.56–2.37) | 1.38 (0.62–3.07) | 1.53 (0.68–3.44) | 0.31 |
| Total β-carotene | |||||
| Median intake, μg/d (IQR) | 1667 (782) | 3005 (840) | 4775 (1051) | 9860 (7069) | |
| Men with remission, n (%) | 26 (28%) | 13 (19) | 23 (26) | 20 (29) | |
| OR (95% CI), kcal adjustment | Reference | 0.60 (0.28–1.31) | 0.96 (0.49–1.90) | 1.13 (0.54–2.37) | 0.46 |
| OR (95% CI), multivariable adjustment | Reference | 0.61 (0.27–1.36) | 1.03 (0.50–2.11) | 1.26 (0.57–2.79) | 0.31 |
| α-Carotene | |||||
| Median intake, μg/d (IQR) | 175 (154) | 371 (187) | 750 (382) | 1717 (1437) | |
| Men with remission, n (%) | 20 (25) | 25 (27) | 15 (20) | 22 (30) | |
| OR (95% CI), kcal adjustment | Reference | 1.17 (0.59–2.34) | 0.87 (0.39–1.93) | 1.52 (0.70–3.29) | 0.27 |
| OR (95% CI), multivariable adjustment | Reference | 1.25 (0.61–2.54) | 0.90 (0.39–2.05) | 1.51 (0.68–3.35) | 0.33 |
| β-Cryptoxanthin | |||||
| Median intake, μg/d (IQR) | 24 (20) | 97 (55) | 204 (64) | 296 (63) | |
| Men with remission, n (%) | 23 (24%) | 28 (33) | 22 (28) | 9 (14) | |
| OR (95% CI), kcal adjustment | Reference | 1.52 (0.79–2.92) | 1.20 (0.60–2.37) | 0.53 (0.23–1.25) | 0.17 |
| OR (95% CI), multivariable adjustment | Reference | 1.53 (0.78–2.99) | 1.22 (0.60–2.49) | 0.50 (0.21–1.19) | 0.14 |
| Lycopene | |||||
| Median intake, μg/d (IQR) | 1111 (539) | 2189 (685) | 3579 (637) | 6291 (5441) | |
| Men with remission, n (%) | 32 (39) | 19 (22) | 17 (23) | 14 (18) | |
| OR (95% CI), kcal adjustment | Reference | 0.43 (0.22–0.85) | 0.47 (0.23–0.99) | 0.33 (0.15–0.73) | 0.02 |
| OR (95% CI), multivariable adjustment | Reference | 0.47 (0.23–0.94) | 0.49 (0.23–1.03) | 0.37 (0.16–0.82) | 0.04 |
| Lutein and zeaxanthin | |||||
| Median intake, μg/d (IQR) | 546 (2999) | 956 (257) | 1662 (385) | 3156 (1491) | |
| Men with remission, n (%) | 32 (32) | 17 (22) | 18 (23) | 15 (22) | |
| OR (95% CI), kcal adjustment | Reference | 0.61 (0.31–1.22) | 0.64 (0.32–1.29) | 0.62 (0.29–1.32) | 0.30 |
| OR (95% CI), multivariable adjustment | Reference | 0.64 (0.32–1.31) | 0.70 (0.34–1.45) | 0.72 (0.32–1.62) | 0.58 |
a Supplemental estimates for carotenoids other than β-carotene were not available. The multivariable model was adjusted for energy (kcal quartiles),, problem drinking (Y/N), history of diagnosed angina (Y/N), and education (high school education or less vs any college or more). Statistical significance was set at p = 0.005 after Bonferroni correction.
IQR = interquartile range; OR = odds ratio; CI = confidence interval; α-TE = α-tocopherol equivalents.
This study used data collected in the Osteoporotic Fractures in Men Study (MrOS), a prospective study of community-dwelling men enrolled from six US sites [16] and [17]. The study was designed to evaluate risk factors for fracture, falls, and other conditions relevant to aging men, including prostate disease and LUTS [17] . From March 2000 to April 2002, 5994 men age 65–100 yr who could walk unassisted and had at least one natural hip for bone density measurement were enrolled. The six sites were Birmingham, AL; Minneapolis, MN; Palo Alto, CA; Pittsburgh, PA; Portland, OR; and San Diego, CA. The study protocol was approved by the institutional review boards at all participating institutions, and all men gave written informed consent.
Baseline measures collected at clinic visits included basic demographic data, lifestyle information (alcohol use, cigarette smoking), medical conditions, self-rated health, quality of life (short-form 12, SF-12 [18] ), and physical activity information based on the Physical Activity Scale for the Elderly (PASE) [19] . Height and weight were measured at the clinic visit and body mass index (BMI) was computed (kg/m2) [20] . Medications and supplements were brought to the baseline clinic visit and were inventoried by study staff and matched to ingredients according to on the Iowa Drug Information Service drug vocabulary (College of Pharmacy, University of Iowa, Iowa City, IA, USA) [21] .
Dietary data were collected at baseline using a brief Block food frequency questionnaire (FFQ) [22] and [23], which contains 69 items specifically drawn from foods most frequently consumed by elderly US men according to an analysis of data from the Third National Health and Nutrition Examination Survey (NHANES III) [22] . The Block FFQ is a validated, robust instrument used in observational research to measure nutrient intake, including antioxidant micronutrients. The brief Block FFQ asks about consumption frequency and portion size for each item. Gram estimates of foods were calculated as the gram weight for the chosen portion size multiplied by the consumption frequency. Nutrients were then estimated using the average amount of a nutrient in a food multiplied by the gram weight consumed. Nutrients from supplements were calculated separately from food estimates. Total intake was calculated as the sum of the nutrient estimates from food plus supplement nutrient estimates, when applicable. Supplement information was available only for the antioxidants vitamin C, vitamin E, and β-carotene.
At baseline and approximately every 2 yr (2002–2004, 2005–2006, and 2007–2009), follow-up data were collected on lower urinary tract health, including the American Urological Association Symptom Index (AUA-SI) and history of LUTS treatment. Additional follow-up occurred every 4 mo via mailed questionnaires to collect reports of deaths and incident prostate cancer cases, which were adjudicated by study physicians using death certificates and pathology reports.
The following baseline variables were classified into categories for the analysis. BMI was classified as normal (<25.0 kg/m2), overweight (25.0–29.9 kg/m2), or obese (≥30.0 kg/m2) [20] . Depressed mood was defined as an SF-12 mental component score ≤45 points [24] . Alcohol consumption was classified as never, ≤14 drinks/wk, or >14 drinks/wk; problem drinking was defined as a CAGE (Cutting down, Annoyance by criticism, Guilty feeling, and Eye-openers) [25] score of >1. Central nervous system (CNS) medication was defined as use of antiepileptics, benzodiazepines, antidepressants, opioids, or sedatives at baseline. Participants missing medication information were coded as nonusers after analyses showed no difference between nonusers and those with missing data.
We first restricted the MrOS cohort to 3594 men who had no history of prostate cancer and no prior or current treatment for LUTS, including surgery or medication (α-blockers, antispasmodics, anticholinergics, 5α-reductase inhibitors). These men were then followed through the fourth AUA-SI assessment (2007–2009). During follow-up, the cohort for trajectory analysis was further restricted to 1740 men who remained free from diagnosed prostate cancer, reported no surgery or medication use for LUTS, and completed all four AUA-SI assessments. A figure demonstrating how the analytic cohort was ascertained for the trajectory analysis has been previously published [26] . The same study demonstrated no significant differences in LUTS trajectory among men with a history of stroke and those who used CNS medications [26] , so we did not exclude them from the present analysis.
Outcomes for this analysis were LUTS trajectories. Details of the trajectory method were reported previously [26] . In brief, group-based trajectory modeling was performed using the AUA-SI data from all four time points. Trajectory modeling uses the maximum likelihood method and applies a semiparametric mixed model to longitudinal data (PROC TRAJ for SAS 9.1) [27], [28], and [29]. The four trajectory types identified were stable (n = 1277), progressing (n = 345), and remitting (n = 98) LUTS groups, and one very small group (n = 20) in which the LUTS trajectory increased and then decreased during follow-up. We identified three LUTS progression trajectories during follow-up: men who progressed from mild to moderate LUTS; men who progressed from moderate to severe LUTS; and men who progressed from low-moderate to high-moderate LUTS [26] .
For the present study, our goal was to determine associations between antioxidant intake and the likelihood of LUTS progression relative to LUTS stability in groups stratified by baseline clinical cut points of mild (AUA-SI 0–7) and moderate (AUA-SI 8–19) LUTS. We excluded men with severe symptoms at baseline (AUA-SI >19) and those who underwent LUTS treatment during follow-up to minimize the potential for confounding and focus on elucidating the natural history of LUTS in elderly men. In addition, we examined the likelihood of LUTS remission relative to LUTS progression in those with moderate baseline symptoms. Therefore, we restricted our analysis to men who had a similar baseline AUA-SI and who were not missing any dietary data (n = 1670; Fig. 1 ).
Distributions of the dietary antioxidant variables were categorized into quartiles among the 3594 men who were untreated for LUTS at baseline. We chose this approach to ensure that all subsequent analyses were similar with regard to the baseline nutrient distributions. Quartiles were formed for dietary antioxidant estimates for vitamins C and E and for the carotenoids (α-carotene, β-carotene, β-cryptoxanthin, lycopene, and lutein/zeaxanthin). In addition, quartiles were formed for diet plus supplement estimates (total intake) for vitamin C, vitamin E, and β-carotene. Analyses were stratified by baseline LUTS (mild vs moderate).
Baseline measures and dietary quartiles were evaluated according to progressing versus stable LUTS and remitting versus progressing LUTS using χ2 tests. Odds ratios (ORs) and corresponding 95% confidence intervals (CIs) were obtained using multivariable logistic regression to evaluate the association of antioxidant intake with LUTS outcomes. We evaluated the following baseline characteristics for model fit by assessing change in the –2 log likelihood using the G statistic [30] : energy intake (quartiles in kcal/d), age (as a continuous variable and in 5-yr age groups: 65–69, 70–74, 75–79, ≥80 yr), study site, BMI (normal weight vs overweight/obese), race (white versus non-white), SF-12 physical and mental component scores, PASE physical activity score (quartiles), walking daily for exercise (Y/N), living alone (Y/N), education (high school or less vs college or more), self-rated heath (excellent, good, or fair/poor/very poor), mobility limitations (Y/N), alcohol intake (none, 1–14 drinks/wk, >14 drinks/wk), problem drinking history (Y/N), smoking (never/ever), caffeine intake (quartiles), diuretic use (Y/N), and CNS medication use (Y/N). We also assessed the presence of comorbid conditions including diabetes, dizziness, cancer, heart disease, hypertension, angina, and back pain. Variables were retained in the models if the G statistic was greater than the critical χ2 value according to degrees of freedom, and these formed the base model for all tests of association. Using this selection procedure, the adjustment variables for those with mild baseline symptoms (AUA-SI 0–7) were energy intake (kcal quartiles), SF-12 mental component score (<50, 50–54, ≥55), history of non–prostate cancer, and mobility limitations. For those with moderate baseline symptoms (AUA-SI 8–14), the adjustment variables were energy intake (kcal quartiles), SF-12 mental component score (<50, 50–54, ≥55), and history of hypertension for the progression analysis, and energy intake (kcal quartiles), problem drinking, history of diagnosed angina, and education (high school education or less vs any college or more) for the remission analysis. Tests for trends were performed using the median of each nutrient quartile as a single continuous variable entered into a logistic regression model, evaluated using the Wald test for coefficients. All analyses were carried out using SAS 9.1 (SAS Institute, Cary, NC, USA) and the significance level was set at p = 0.005 after Bonferroni correction for multiple comparisons.
Overall, we observed no significant associations between antioxidant intake and LUTS progression or remission over approximately 7 yr of follow-up. To the best of our knowledge, this is the first study to examine associations between dietary antioxidants and LUTS progression. It is also the first study to describe associations between dietary factors and spontaneous remission of LUTS by analyzing whether dietary factors are associated with LUTS remission in otherwise untreated men.
Our results differ from those for prior cross-sectional studies and fail to confirm beneficial associations between higher antioxidant intake and lower risk of LUTS and BPH previously observed in some populations. Rohrman and colleagues [8] reported that dietary intakes of vitamin C, lutein/zeaxanthin, and β-cryptoxanthin in the Health Professionals Follow-up Study were inversely associated with total BPH (the combined endpoint of either surgery for BPH or high/moderate to severe LUTS). Similarly, Maserejian and colleagues [10] reported 40–50% lower odds of LUTS for high dietary intake of vitamin C and β-cryptoxanthin among men with high iron intake. A study examining serum concentrations of micronutrients from NHANES III data also reported lower serum concentrations of vitamin E in men with compared to men without LUTS [9] . It is possible that the null association between antioxidant intake and LUTS in the older men in this study could be due to a lack of effect of antioxidants in older individuals. Future research may demonstrate different effects in younger populations. It is also possible that prior studies were limited by a cross-sectional design or that factors such as recall bias or measurement error confounded the results. In fact, the longitudinal nature of our analysis was a prominent strength of our study that could have provided a more robust characterization of LUTS over time compared to other cohorts.
Unexpectedly, for those with moderate LUTS at baseline, there was a lower likelihood of LUTS remission among men with the highest lycopene intakes, although this observation did not reach statistical significance after correction for multiple comparisons. Further research is needed to determine whether similar results are observed in longitudinal analyses in other large cohorts. Lycopene was associated with lower LUTS odds in two cross-sectional studies [9] and [10] and one BPH study [11] ; therefore, if this association is found to be valid, it would be contrary to previous research on lycopene.
Our study has multiple strengths. We used a robust definition of LUTS progression obtained via a group-based trajectory method, which reduced the inherent variability in symptom scores and allowed clear identification of symptom progression over time. Another strength is the exclusion of men treated for LUTS with medication or surgery from the analytic cohort to provide an unbiased natural history of the disease, free of potential treatment effects that would otherwise change the symptom trajectory and confound the findings. Finally, the study included a geographically diverse group of community-dwelling elderly men in the USA who had an extended follow-up of approximately 7 yr.
One main limitation of our study is use of the brief Block FFQ, which has fewer food groups than other FFQs and may have biased results toward the null hypothesis. For example, pumpkin is not included in the instrument, yet it is the highest dietary source of β-cryptoxanthin and the second highest source of β-carotene. Thus, if a man consumed pumpkin regularly, he may have been incorrectly categorized as a lower rather than a higher consumer of these antioxidants. However, any misclassification should have been random with regard to LUTS progression, since men did not know their future LUTS status when filling out the baseline FFQ, and thus would have biased results toward the null hypothesis. A second limitation is the relatively small number of non-Caucasian men in the cohort, which probably diminished the external validity of the results with respect to other ethnic and racial groups. A third limitation is that dietary information was only collected at baseline; it is possible that some study participants may have subsequently altered their diets during follow-up, leading to a potential for bias. Finally, we were unable to assess objective urologic measures such as urinary flow, prostate volume, prostate-specific antigen (PSA), and voiding diaries.
Higher intakes of the antioxidants vitamin C, vitamin E, β-carotene, α-carotene, β-cryptoxanthin, lycopene, and lutein/zeaxanthin were not associated with a lower risk of LUTS progression or a higher risk of remission over approximately 7 yr of follow-up in community-dwelling elderly men.
Author contributions: J. Kellogg Parsons had full access to all the data in the study and takes responsibility for the integrity of the data and the accuracy of the data analysis.
Study concept and design: Holton, Marshall, Parsons.
Acquisition of data: Holton, Marshall.
Analysis and interpretation of data: Holton, Marshall, Shannon, Lapidus.
Drafting of the manuscript: Holton, Marshall, Parsons.
Critical revision of the manuscript for important intellectual content: Marshall, Parsons, Shikany, Bauer, Barrett-Connor.
Statistical analysis: Holton, Marshall, Shannon, Lapidus.
Obtaining funding: Marshall, Parsons.
Administrative, technical, or material support: Shannon, Lapidus.
Supervision: Marshall.
Other: None.
Financial disclosures: J. Kellogg Parsons certifies that all conflicts of interest, including specific financial interests and relationships and affiliations relevant to the subject matter or materials discussed in the manuscript (eg, employment/affiliation, grants or funding, consultancies, honoraria, stock ownership or options, expert testimony, royalties, or patents filed, received, or pending), are the following: None.
Funding/Support and role of the sponsor: This research was supported by Grant R21 DK083675 from the National Institute for Diabetes, Digestive and Kidney Diseases. The Osteoporotic Fractures in Men (MrOS) Study is supported by National Institutes of Health (NIH) funding. The National Institute of Arthritis and Musculoskeletal and Skin Diseases (NIAMS), the National Institute on Aging (NIA), the National Center for Research Resources (NCRR), and the NIH Roadmap for Medical Research provided support under grant numbers U01 AR45580, U01 AR45614, U01 AR45632, U01 AR45647, U01 AR45654, U01 AR45583, U01 AG18197, U01 AG027810, and UL1 TR000128. The sponsors played a role in data collection, management, and analysis.