Background
The clinical diagnosis of detrusor underactivity (DU) is hampered by the need for invasive pressure flow studies (PFS) in combination with a lack of knowledge of the associated signs and symptoms. This has contributed to a lack of awareness of DU and underactive bladder, and to the assumption that symptoms are always due to bladder outlet obstruction (BOO).
Objective
To investigate the signs and symptoms recorded in a large urodynamic database of patients who met the diagnoses of DU, BOO, and normal, to identify the clinical features associated with DU.
Design, setting, and participants
From the database of 28 282 adult PFS records, 1788 patients were classified into: (1) those with DU without BOO; (2) those with BOO without DU; and (3) those with normal PFS.
Results
Patients with DU reported a statistically significantly higher occurrence of decreased and/or interrupted urinary stream, hesitancy, feeling of incomplete bladder emptying, palpable bladder, and absent and/or decreased sensation compared with patients with normal PFS. Other differences were found between men with DU and BOO, and between women with DU and normal PFS.
Conclusions
There are signs and symptoms that can distinguish DU patients from patients with normal PFS and further distinguish between DU and BOO, which is traditionally invasively diagnosed. This is a first step to better understand the clinical presentation of DU patients, is consistent with the recent underactive bladder working definition, and justifies further exploration of the signs and symptoms of DU.
Patient summary
The clinical diagnosis of detrusor underactivity is hampered by the need for invasive urodynamics in combination with a lack of knowledge of the associated signs and symptoms. This study has shown that there are signs and symptoms that can distinguish men and women patients with DU from patients with either normal urodynamic studies or with BOO.
The clinical diagnosis of detrusor underactivity (DU) is hampered by the need for invasive pressure flow studies (PFS) and a lack of knowledge of the associated signs and symptoms. This has contributed to a lack of awareness of DU and its clinical correlate, underactive bladder (UAB) [1]. In consequence, this condition has been neglected compared with other causes of lower urinary tract symptoms. A recent review [2] concluded that DU “is surrounded by ambiguity” and recognises the limitations of the current definition. The International Continence Society defines DU as “a contraction of reduced strength and/or duration, resulting in prolonged bladder emptying and/or a failure to achieve complete bladder emptying within a normal time span” [3]. This, however, does not define “prolonged bladder emptying” or “normal time span”. Various methods have been proposed to determine contraction strength [2]; however, none of these take into account the duration of contraction – a key factor in the definition [3].
Despite this imprecision, estimates suggest that DU is a prevalent condition, ranging from 9% to 23% in men <50 yr, increasing to as much as 48% in men >70 yr [2]. Elderly women show a DU prevalence ranging from 12% to 45% [2]. An analysis of the signs and symptoms associated with DU could potentially facilitate the diagnosis of patients with UAB, improve our knowledge of the epidemiology, indicate possible noninvasive diagnostic approaches, and facilitate the development and evaluation of treatment outcomes of new therapies for UAB [4].
The aim of this study was to investigate the signs and symptoms recorded in a large database of patients referred for urological evaluation who met strictly defined PFS criteria for DU, bladder outlet obstruction (BOO) or normal, in order to identify the clinical features associated with DU.
Data from patients who underwent PFS, studied in a single specialist centre between 1985 and 2012, were recorded in a database that used the same variable fields throughout the 28-yr period.
Data gathering included patient interview to obtain symptoms and medical history, bladder diary data, physical examination, urodynamic studies, and diagnostic conclusions. PFS were carried out according to International Continence Society guidelines current at the time of testing. Free flow uroflowmetry was performed before each PFS. Postvoid residual urine volume was based on the volume obtained with catheterisation before filling commenced. The data from each PFS were screened for artefacts and manually entered into the database, thus avoiding automated data extraction errors. Prior to analysing the data, impossible values were removed in order to reduce corruption of data by manual entry errors. Several categorical (yes/no) variables used in the analysis were derived from a combination of database entry fields. For example, additional variables for straining and for decreased sensation were derived by combining the number of patients who reported these as symptoms with the number of patients for whom these were noted during PFS.
Patients without full voiding data, with neurological diseases affecting the lower urinary tract such as multiple sclerosis, paraplegia, or Parkinson's disease, and/or with a urodynamic diagnosis of detrusor overactivity were excluded as these require special consideration [5]. This resulted in 9928 eligible patient records (men: 1639; women: 8289) without confounding causes of vesico-urethral dysfunction (Fig. 1).
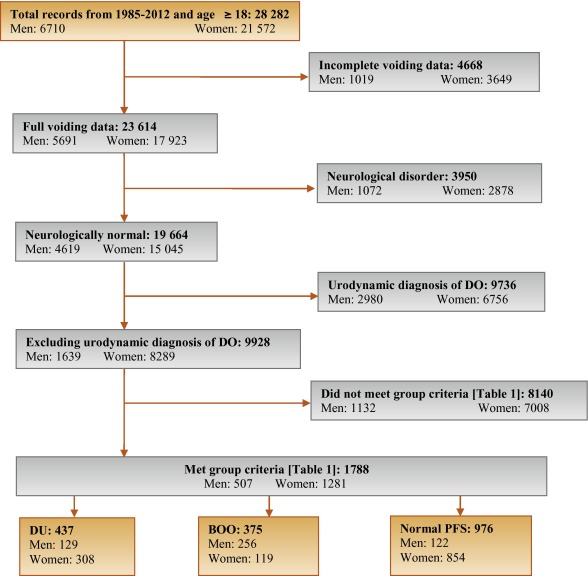
In order to classify patients with pure DU, BOO, or normal PFS, very strict criteria were used to avoid overlap. The criterion values were based on expert opinion and are shown in Table 1, which are in line with other studies cited by Osman et al [2]. A normal group was composed of patients with PFS judged to be normal, taking no medication related to bladder or urethra, and (for women) no clinical obstruction. Men who had both a low bladder contractility index and a high BOO index, suggesting simultaneous DU and BOO, were excluded from the analysis. Women patients with clinical obstruction, defined as urethral/bladder neck obstruction and/or large cystocoele or prolapse through the introitus, were also excluded from the DU and normal groups. Using these criteria, 1788 patient records (men: 507; women: 1281) were classified to DU, BOO, or normal PFS groups and used in the analysis (Fig. 1).
Table 1 Inclusion criteria used for patient grouping
| Men | Women | ||||||
|---|---|---|---|---|---|---|---|
| Group | BCI | BOOI | BVE % | pdetQmax | Qmax | BVE % | Excluding COb |
| DU | <100 | <20 | <90 | <20 | <15 | <90 | X |
| BOO | ≥100 | ≥40 | ≥90 | ≥40 | <12 | ≥90 | |
| Normal PFSa | ≥100 | <20 | 100 | ≥20 | ≥20 | 100 | X |
a A normal pressure flow study is a test with no abnormal pressure flow study findings and no present medication use related to bladder or urethra, in addition to the criteria listed.
b Clinical obstruction for women patients was considered as the clinician recording either a urethral or bladder neck obstruction during a video urodynamic test or a large cystocoele or prolapse through the introitus on examination.
BCI = bladder contractility index; BVE = bladder voiding efficiency; BOO = bladder outlet obstruction; BOOI = Bladder Outlet Obstruction Index; CO = clinical obstruction; DU = detrusor underactivity; pdetQmax = detrusor pressure at maximum flow rate; Qmax = maximum flow rate; PFS = pressure flow studies.
For all variables, the primary question was whether there was a difference in the reported values (numerical variables) or percentage of patients who reported a variable (categorical variables) for patients with DU compared with those with BOO or normal PFS.
For categorical variables, descriptive statistics for the number and percentage of patient records in each category were tabulated by patient group. Logistic regression models including patient group and age as factors were used for each binary variable. A p value for the hypothesis test that the odds ratio for each pair-wise comparison (DU vs BOO; DU vs normal PFS) was equal to 1 are provided with 95% confidence intervals. For example, a variable with an odds ratio for DU/BOO of 4.5 suggests that, after adjusting for age, the odds of a DU patient reporting the symptom are 4.5 times higher than for a patient with BOO. For cases where zero patients reported a variable outcome (ie, yes or no) in at least one group, estimates were obtained using exact logistic regression.
For numerical variables, descriptive statistics for the number of patients, median, and interquartile range (Q1–Q3) were summarised. PFS variables that were used to classify patients into groups (Table 1) were excluded from the analysis. Due to several variables appearing to be not normally distributed, a separate rank analysis of covariance model using patient group as factor and age as covariate was used for each pair-wise comparison (DU vs BOO; DU vs normal PFS). The rank analysis of covariance was utilised for hypothesis testing and p values were calculated from a mean score test comparing the groups using the values of the residuals as scores. No multiplicity adjustments were performed in this exploratory analysis which aimed to generate rather than confirm hypotheses. Future studies aimed at confirming hypotheses would, however, make these adjustments.
Age for men and women DU patients was statistically significantly higher compared with patients with normal PFS (median values: men 63 yr vs 55 yr; women 59 yr vs 44 yr). Age for women with DU was statistically significantly higher compared with women with BOO (median, 59 yr vs 44 yr). There were no significant differences in height, weight, or body mass index between the groups.
Table 2 and Table 3 show the odds ratios and corresponding 95% confidence intervals for categorical variables that showed a statistically significant difference between DU patients and at least one other group (p < 0.05). Table 4 gives a summary of medians and interquartile ranges for numerical variables that had statistically significant differences between DU patients and at least one other group. Supplementary Table 6 details all variables included in the analysis, so it may be deduced which variables were not statistically significantly different between groups by their absence from other tables.
Table 2 Men: odds ratios and 95% confidence intervals for categorical variables of detrusor underactivity compared with bladder outlet obstruction and normal pressure flow studies, using logistic regression model with patient group and age as factors
| Variable | Males, n (%) | ||||
|---|---|---|---|---|---|
| DU (n = 129) |
BOO (n = 256) |
Normal (n = 122) |
OR (CI) for DU/BOO | OR (CI) for DU/Normal | |
| Signs and symptoms | |||||
| Urinary stream decreased | 55 (56%) | 150 (82%) | 28 (30%) | 0.31*** (0.18, 0.54) |
3.02** (1.65, 5.56) |
| Hesitancy | 47 (51%) | 126 (69%) | 25 (26%) | 0.47** (0.28, 0.80) |
3.27** (1.74, 6.15) |
| Abnormal sexual function | 30 (41%) | 34 (26%) | 21 (29%) | 2.32* (1.20, 4.48) |
1.20 (0.55, 2.58) |
| Feeling of incomplete bladder emptying | 37 (36%) | 55 (29%) | 22 (22%) | 1.29 (0.77, 2.16) |
2.16* (1.14, 4.08) |
| Urgency, fear of leakage | 31 (30%) | 83 (45%) | 35 (35%) | 0.54* (0.32, 0.90) |
0.76 (0.42, 1.38) |
| Stress incontinence | 17 (25%) | 4 (3.7%) | 16 (22%) | 9.14** (2.91, 28.7) |
1.05 (0.48, 2.33) |
| Enuresis | 15 (21%) | 2 (1.8%) | 15 (21%) | 13.7** (3.02, 62.3) |
1.12 (0.46, 2.55) |
| Urinary stream interrupted | 19 (19%) | 20 (11%) | 9 (9.2%) | 1.88 (0.95, 3.72) |
2.42* (1.02, 5.73) |
| Palpable bladder | 13 (14%) | 1 (0.6%) | 1 (1.1%) | 28.0** (3.60, 218.1) |
13.5* (1.71, 106.5) |
| Absent or decreased sensation | 13 (13%) | 3 (3.0%) | 36.0 ***,a (7.47, ∞) |
4.57* (1.24, 16.9) |
|
| Bowel function – strains | 9 (11%) | 4 (2.4%) | 5 (5.6%) | 4.98** (1.48, 16.8) |
1.73 (0.54, 5.51) |
| Feeling of incomplete bowel emptying | 7 (8.6%) | 1 (0.6%) | 15.2* (1.83, 126.2) |
10.2*,a (1.93, ∞) |
|
| Always strains to void | 8 (8.0%) | 1 (0.5%) | 13.5* (1.63, 111.8) |
15.6**,a (2.95, ∞) |
|
| Bowel function: poor control or urgency | 5 (5.4%) | 1 (0.6%) | 5 (5.4%) | 9.84* (1.13, 85.8) |
1.08 (0.29, 4.02) |
| Medical history | |||||
| TURP surgeryb | 36 (72%) | 2 (5.9%) | 28 (60%) | 75.3*** (13.8, 410.4) |
1.38 (0.48, 3.93) |
| Bladder outlet obstruction surgeryb | 52 (51%) | 4 (2.3%) | 35 (36%) | 63.1*** (20.9, 189.9) |
1.26 (0.65, 2.43) |
| Any retentionc | 39 (39%) | 9 (4.9%) | 13 (14%) | 13.0*** (5.92, 28.4) |
3.63** (1.76, 7.47) |
| Surgery with possible denervation | 11 (30%) | 2 (5.7%) | 1 (3.2%) | 4.91 (0.95, 25.5) |
20.4** (2.17, 191.5) |
| Reported history of ≥1 UTI | 29 (28%) | 25 (14%) | 21 (21%) | 2.52** (1.38, 4.61) |
1.50 (0.78, 2.89) |
| Spontaneous retentionc | 21 (20%) | 4 (2.2%) | 9 (9.4%) | 11.6*** (3.87, 35.0) |
2.34 (1.00, 5.48) |
| Chronic retentionc | 14 (14%) | 1 (0.5%) | 29.2** (3.78, 226.0) |
17.5**,a (3.60, ∞) |
|
| Present drug use – antibiotics | 8 (8.3%) | 4 (2.4%) | 1 (1.1%) | 3.56* (1.03, 12.3) |
10.2* (1.20, 86.8) |
| Present drug use – antidepressants | 6 (6.2%) | 6 (3.5%) | 1.65 (0.51, 5.38) |
10.8*,a (1.92, ∞) |
|
| Invasive measurements – pressure flow studies | |||||
| Reduced filling phase sensation | 34 (28%) | 2 (0.9%) | 3 (2.5%) | 44.5*** (10.5, 189.4) |
17.3*** (5.05, 59.4) |
| Voids by straining | 20 (16%) | 64.8 ***,a (13.9, ∞) |
31.8 ***,a (6.79, ∞) |
||
| Detrusor contraction with strain | 12 (9.8%) | 2 (0.8%) | 1 (0.8%) | 12.8** (2.80, 58.0) |
12.6* (1.60, 99.7) |
| Combined variables (symptoms reported by patient and/or noted during invasive measurement) | |||||
| Decreased sensation | 42 (40%) | 2 (1.1%) | 6 (6.2%) | 59.6*** (14.0, 253.5) |
10.9*** (4.28, 27.8) |
| Straining | 37 (37%) | 3 (1.6%) | 1 (1.0%) | 35.5*** (10.6, 119.2) |
54.5** (7.25, 409.3) |
* indicates that the difference from the detrusor underactivity group was significant for p < 0.05.
** indicates that the difference from the detrusor underactivity group was significant for p < 0.01.
*** indicates that the difference from the detrusor underactivity group was significant for p < 0.0001.
a For cases where zero patients reported a variable outcome in at least one group, estimates were obtained using exact logistic regression which provides median unbiased estimates for odds ratios and sets upper 95% confidence interval values equal to infinity (∞).
b Patients could report up to two types of surgery. Bladder outlet obstruction surgery for men counts the number of patients who reported at least one of the following: transurethral resection of the prostate, radical perineal prostatectomy, bladder neck incision, or urethral dilatation.
c History of retention: patients could report up to two types of retention. Any retention counts the number of men who reported at least one of the following: acute retention after operation, chronic retention, or spontaneous retention.
BOO = bladder outlet obstruction; CI = confidence interval; DU = detrusor underactivity; OR = odds ratio; PFS = pressure flow studies; UTI = urinary tract infection.
Only variables with a statistically significant result for any group versus detrusor underactivity are included, for economy of space.
An odds ratio, for example, of 4.5 for detrusor underactivity/bladder outlet obstruction suggests that after adjusting for age, the odds of a detrusor underactivity patient reporting the symptom are 4.5 times higher than for a patient with BOO. Table 2 presents variables in descending order of frequency for the detrusor underactivity group. Percentages of patients reporting a symptom are based on total number of patients with non-missing data to derive a yes or no response. For economy of space, only the % of patients who reported ‘yes’ are displayed.
Table 3 Women: odds ratios and 95% confidence intervals for categorical variables of detrusor underactivity compared with bladder outlet obstruction and normal pressure flow studies, using logistic regression model with patient group and age as factors
| Variable | Women, n (%) | ||||
|---|---|---|---|---|---|
| DU (n = 308) |
BOO (n = 119) |
Normal (n = 854) |
OR (CI) for DU/BOO | OR (CI) for DU/Normal | |
| Signs and symptoms | |||||
| Stress incontinence | 203 (79%) | 61 (66%) | 656 (81%) | 1.91* (1.11, 3.28) |
0.87 (0.60, 1.28) |
| Urinary stream decreased | 75 (29%) | 21 (20%) | 32 (4.0%) | 1.81* (1.00, 3.25) |
10.8*** (6.56, 17.7) |
| Hesitancy | 78 (28%) | 29 (27%) | 75 (9.1%) | 1.01 (0.59, 1.71) |
3.71*** (2.49, 5.52) |
| Feeling of incomplete bladder emptying | 78 (28%) | 39 (36%) | 160 (20%) | 0.70 (0.43, 1.15) |
1.62** (1.14, 2.29) |
| Mobility impaired | 32 (13%) | 4 (4.3%) | 19 (2.8%) | 1.51 (0.49, 4.62) |
1.98* (1.00, 3.91) |
| Enuresis | 31 (12%) | 5 (5.3%) | 68 (8.4%) | 3.21* (1.18, 8.75) |
1.98** (1.19, 3.28) |
| Urinary stream interrupted | 32 (12%) | 10 (9.2%) | 9 (1.1%) | 1.22 (0.55, 2.73) |
10.9*** (4.81, 24.6) |
| Absent or decreased sensation | 12 (4.3%) | 7 (0.8%) | 8.56*,a (1.64, ∞) |
5.80** (1.99, 16.8) |
|
| Palpable bladder | 8 (3.3%) | 11 (1.5%) | 5.04a (0.89, ∞) |
3.34* (1.16, 9.60) |
|
| Medical history | |||||
| Reported history of ≥1 UTI | 112 (40%) | 41 (38%) | 242 (29%) | 1.24 (0.77, 2.01) |
1.83** (1.33, 2.50) |
| Any retentionb | 50 (19%) | 8 (7.5%) | 55 (6.8%) | 2.94** (1.30, 6.64) |
3.27*** (2.05, 5.22) |
| Acute retention after operation or childbirthb | 35 (13%) | 7 (6.6%) | 52 (6.4%) | 2.02 (0.84, 4.86) |
2.08** (1.24, 3.47) |
| Present drug use – diuretics | 33 (12%) | 3 (2.8%) | 25 (3.1%) | 2.40 (0.70, 8.31) |
1.99* (1.07, 3.71) |
| Present drug use – antidepressants | 31 (11%) | 3 (2.8%) | 4.34* (1.23, 15.4) |
149.0***,a (31.7, ∞) |
|
| Present drug use – antibiotics | 13 (4.8%) | 3 (2.8%) | 15 (1.8%) | 2.03 (0.53, 7.72) |
3.13** (1.33, 7.34) |
| Spontaneous retentionb | 11 (4.0%) | 1 (0.9%) | 3 (0.4%) | 6.01 (0.71, 50.9) |
15.2** (3.80, 60.9) |
| Surgery with possible denervation | 8 (3.3%) | 1 (1.0%) | 5 (0.6%) | 2.72 (0.31, 23.8) |
4.28* (1.18, 15.4) |
| Present drug use – oral contraceptives | 2 (0.7%) | 16 (15%) | 59 (7.3%) | 0.20* (0.04, 0.97) |
0.44 (0.10, 1.92) |
| Invasive measurements – Pressure flow studies | |||||
| Voids by straining | 55 (18%) | 1 (0.8%) | 3 (0.3%) | 24.7** (3.31, 183.5) |
59.2*** (17.7, 198.1) |
| Detrusor contraction with strain | 39 (13%) | 13 (11%) | 25 (2.9%) | 1.21 (0.60, 2.46) |
4.98*** (2.79, 8.90) |
| Reduced filling phase sensation | 35 (12%) | 3 (2.7%) | 15 (2.0%) | 4.87* (1.42, 16.7) |
6.67*** (3.33, 13.4) |
| After contraction | 4 (1.4%) | 19 (17%) | 191 (24%) | 0.09*** (0.03, 0.27) |
0.06*** (0.02, 0.16) |
| Combined variables (symptom reported by patient and/or noted during invasive measurement) | |||||
| Straining | 95 (34%) | 15 (14%) | 29 (3.5%) | 3.13** (1.67, 5.87) |
13.7*** (8.35, 22.3) |
| Decreased sensation | 42 (16%) | 3 (3.0%) | 22 (3.0%) | 5.40** (1.58, 18.4) |
5.28*** (2.88, 9.69) |
* indicates that the difference from the detrusor underactivity group was significant for p < 0.05.
** indicates that the difference from the detrusor underactivity group was significant for p < 0.01.
*** indicates that the difference from the detrusor underactivity group was significant for p < 0.0001.
a For cases where zero patients reported a variable outcome in at least one group, estimates were obtained using exact logistic regression which provides median unbiased estimates for odds ratios and sets upper 95% confidence interval values equal to infinity (∞).
b History of retention: patients could report up to two types of retention. Any retention counts the number of women who reported at least 1 of the following: acute retention after operation or childbirth, chronic or spontaneous retention.
BOO = bladder outlet obstruction; CI = confidence interval; DU = detrusor underactivity; OR = odds ratio; PFS = pressure flow studies; UTI = urinary tract infection.
Only variables with a statistically significant result for any group versus detrusor underactivity are included, for economy of space. An odds ratio, for example, of 4.5 for detrusor underactivity/bladder outlet obstruction suggests that after adjusting for age, the odds of a detrusor underactivity patient reporting the symptom are 4.5 times higher than for a patient with bladder outlet obstruction. Table 3 presents variables in descending order of frequency for the detrusor underactivity group. Percentages of patients reporting a symptom are based on total number of patients with non-missing data to derive a yes or no response. For economy of space, only the % of patients who reported ‘yes’ are displayed.
Table 4 Medians and interquartile ranges of numerical variables for detrusor underactivity compared with bladder outlet obstruction and normal pressure flow studies
| Variable | Statistic | Men | Women | ||||
|---|---|---|---|---|---|---|---|
| DU (n = 129) |
BOO (n = 256) | Normal (n = 122) | DU (n = 308) |
BOO (n = 119) | Normal (n = 854) | ||
| Medical History | |||||||
| Age at visit (yr) | n | 129 | 256 | 122 | 308 | 119 | 854 |
| Median | 63.0 | 63.0 | 55.5** | 59.0 | 44.0*** | 44.0*** | |
| Q1–Q3 | (49.0–72.0) | (56.0–69.0) | (40.0–68.0) | (49.0–71.0) | (37.0–56.0) | (36.0–52.0) | |
| Noninvasive measurements – bladder diary | |||||||
| Daytime micturitions | n | 86 | 167 | 84 | 247 | 100 | 758 |
| Median | 6.0 | 8.0** | 7.0 | 8.0 | 8.0 | 7.0** | |
| Q1 – Q3 | (5.0–8.0) | (6.0–9.0) | (5.0–9.5) | (7.0–10.0) | (6.0–10.0) | (6.0–9.0) | |
| Total nocturia episodes/24 h | n | 85 | 169 | 85 | 249 | 101 | 754 |
| Median | 1.0 | 2.0 | 1.0 | 1.5 | 1.0 | 0.5*** | |
| Q1–Q3 | (0.0–3.0) | (1.0–2.0) | (0.1–2.0) | (1.0–2.0) | (0.2–2.0) | (0.0–1.0) | |
| Max time (h) between daytime voids | n | 70 | 156 | 70 | 218 | 90 | 661 |
| Median | 4.0 | 3.0** | 4.0 | 3.0 | 3.0 | 3.5** | |
| Q1–Q3 | (3.0–5.0) | (2.5–4.0) | (2.5–5.0) | (2.0–4.0) | (2.0–4.0) | (3.0–4.5) | |
| Pads used in daytime | n | 17 | 3 | 10 | 150 | 32 | 335 |
| Median | 3.0 | 1.0 | 2.5 | 3.0 | 2.0 | 2.0** | |
| Q1–Q3 | (1.0–3.0) | (0.0–4.0) | (2.0–3.0) | (2.0–4.0) | (1.0–3.5) | (1.0–3.0) | |
| Pads used at night | n | 16 | 2 | 9 | 118 | 30 | 278 |
| Median | 1.0 | 1.0 | 0.0 | 1.0 | 0.0 | 0.0* | |
| Q1–Q3 | (1.0–1.0) | (1.0–1.0) | (0.0–1.0) | (0.0–1.0) | (0.0–1.0) | (0.0–1.0) | |
| Invasive measurements – pressure flow studies | |||||||
| Bladder volume at first desire (ml) | n | 114 | 230 | 120 | 282 | 115 | 812 |
| Median | 350 | 180*** | 280** | 230 | 200* | 280*** | |
| Q1–Q3 | (200–500) | (130–240) | (190–360) | (160–330) | (140–270) | (210–370) | |
| Volume at urgent desire (ml) | N | 19 | 66 | 33 | 57 | 33 | 202 |
| Median | 380 | 260** | 400 | 260 | 280 | 400*** | |
| Q1–Q3 | (220–610) | (200–310) | (250–440) | (180–340) | (190–330) | (310–500) | |
| Volume when leakage occurs (ml) | N | 16 | 2 | 10 | 171 | 23 | 309 |
| Median | 240 | 30** | 250 | 330 | 310 | 440*** | |
| Q1–Q3 | (180–290) | (20–50) | (200–350) | (250–400) | (260–390) | (350–540) | |
| Cystometric capacity (ml) | N | 129 | 256 | 122 | 308 | 119 | 854 |
| Median | 500 | 300*** | 440** | 360 | 320** | 450*** | |
| Q1–Q3 | (320–690) | (240–360) | (350–520) | (290–460) | (260–400) | (370–540) | |
| Compliance (ml/cmH2O) | N | 119 | 213 | 115 | 275 | 113 | 823 |
| Median | 125 | 89 | 157* | 205 | 154 | 258** | |
| Q1–Q3 | (50–287) | (49–254) | (75–426) | (86–310) | (68–252) | (99–390) | |
| Abdominal pressure at Qmax (cmH20) | N | 127 | 256 | 122 | 307 | 119 | 850 |
| Median | 55 | 40*** | 40*** | 36 | 22*** | 25*** | |
| Q1–Q3 | (40–75) | (32–46) | (32–45) | (25–51) | (15–35) | (17–32) | |
| Volume voided (ml) | N | 129 | 256 | 122 | 308 | 119 | 854 |
| Median | 230 | 290*** | 440*** | 200 | 310*** | 450*** | |
| Q1–Q3 | (130–360) | (250–360) | (340–520) | (130–290) | (260–390) | (370–540) | |
* indicates difference from detrusor underactivity group was significant for p < 0.05.
** indicates difference from detrusor underactivity group was significant for p < 0.01.
*** indicates difference from detrusor underactivity group was significant for p < 0.0001.
Q1 = 25th percentile; Q3 = 75th percentile; BOO = bladder outlet obstruction; DU = detrusor underactivity; PFS = pressure flow studies.
The p-values were derived using mean score test on residuals from rank analysis of covariance model with patient group as factor and age as covariate. A p-value for age at visit is taken from Wilcoxon rank sum test, as analysis of covariance cannot include age as both response variable and covariate.
The primary group comparisons of interest were DU versus BOO in men (the most difficult clinical differential diagnosis) and DU versus normal PFS in women. These comparisons are therefore described below and are all adjusted for age.
Refer to Supplementary Figure 2 (men) and Figure 3 (women) of forest plots and Table 5 showing symptoms with statistically significant differences for patients with DU compared with those with normal PFS or BOO.
Table 5 Summary of symptoms with statistically significant differences reported for patients with detrusor underactivity compared with those with normal pressure flow studies or with bladder outlet obstruction
| Men | Women | ||
|---|---|---|---|
| Higher occurrence for DU vs normal PFS |
Higher occurrence for DU vs BOO |
Higher occurrence for DU vs normal PFS |
Higher occurrence for DU vs BOO |
| Decreased urinary stream | Abnormal sexual function | Decreased urinary stream | Decreased urinary stream |
| Interrupted urinary stream | Stress incontinence | Interrupted urinary stream | Stress incontinence |
| Hesitancy | Enuresis | Hesitancy | Enuresis |
| Incomplete bladder emptying | Palpable bladder | Incomplete bladder emptying | Absent and/or decreased sensation |
| Palpable bladder | Absent and/or decreased sensation | Palpable bladder | |
| Absent and/or decreased sensation | Always strain to void | Absent and/or decreased sensation | |
| Always strain to void | Bowel strain | Enuresis | |
| Incomplete bowel emptying | Incomplete bowel emptying | Impaired mobility | |
| Poor bowel control | |||
| Lower occurrence for DU vs normal PFS |
Lower occurrence for DU vs BOO |
Lower occurrence for DU vs normal PFS |
Lower occurrence for DU vs BOO |
|---|---|---|---|
| None | Decreased urinary stream | None | None |
| Hesitancy | |||
| Urgency |
BOO = bladder outlet obstruction; DU = detrusor underactivity; PFS = pressure flow studies.
Men with DU reported a statistically significantly higher occurrence of decreased and/or interrupted urinary stream, hesitancy, feeling of incomplete bladder emptying, palpable bladder, feeling of incomplete bowel emptying, absent and/or decreased sensation, and always straining to void compared with men with normal PFS. Men with DU reported a statistically significantly higher occurrence of abnormal sexual function, stress incontinence, enuresis, palpable bladder, absent and/or decreased sensation, always straining to void, bowel straining, feeling of incomplete bowel emptying, and poor bowel control compared with men with BOO. A statistically significant lower occurrence of decreased urinary stream, hesitancy, and urgency was reported for men with DU compared with men with BOO.
Women with DU reported a statistically significantly higher occurrence of decreased and/or interrupted urinary stream, hesitancy, feeling of incomplete bladder emptying, palpable bladder, absent and/or decreased sensation, enuresis, and impaired mobility compared with women with normal PFS.
Men with DU reported a statistically significantly higher occurrence of retention, surgery with possible denervation of bladder and/or bowel, and use of antibiotics and/or antidepressants compared with men with normal PFS. Men with DU reported a statistically significantly higher occurrence of BOO surgery, retention, one or more urinary tract infections, and use of antibiotics compared with men with BOO.
Women with DU reported a statistically significantly higher occurrence of retention, surgery with possible denervation of bladder and/or bowel, one or more urinary tract infections, and use of antidepressants, antibiotics, and/or diuretics compared with women with normal PFS.
Men with DU reported a statistically significantly higher occurrence of reduced filling phase sensation, detrusor contraction with strain, and voiding by straining compared with men with normal PFS or BOO.
Men with DU reported statistically significantly higher values for bladder volume at first desire to void, cystometric capacity, and abdominal pressure at Qmax compared with men with normal PFS, but statistically significantly lower values for bladder compliance and volume voided. Men with DU reported statistically significantly higher values for bladder volumes at first and urgent desire to void, when leakage occurred, and at cystometric capacity, and abdominal pressure at Qmax compared with men with BOO, but statistically significantly lower values for volume voided.
Women with DU reported a statistically significantly higher occurrence of reduced filling phase sensation, detrusor contraction with strain, and voiding by straining compared with women with normal PFS, but a statistically significantly lower occurrence of after contraction.
Women with DU reported a statistically significantly higher value for abdominal pressure at Qmax compared with women with normal PFS, but statistically significantly lower values for bladder volumes at first and urgent desire to void, when leakage occurred, and at cystometric capacity, for volume voided, and for bladder compliance.
Men and women with DU reported a statistically significantly higher occurrence of both decreased sensation and straining compared with patients with normal PFS or BOO.
Men with DU reported a statistically significantly higher value for maximum time between voids and a statistically significantly lower value for number of daytime micturitions compared with BOO patients.
Women with DU reported a statistically significantly higher value for daytime micturitions, nocturia episodes, and day and night time pad use compared with women with normal PFS, but a statistically significantly lower value for maximum time between voids.
This study shows that cross-sectional data can be used to associate signs and symptoms with urodynamically-defined DU.
Two earlier studies failed to detect clear differences in clinical presentation of DU patients compared with other patients, and concluded that few symptoms were helpful [6] and [7], whereas this study and another recent report in women by Rademakers et al [8] used strict criteria and a wide range of symptoms.
The present study corroborated Rademakers et al's [8] findings of an increased prevalence of incomplete bladder emptying, hesitancy, and a weak stream in women with DU compared with women with normal PFS. Some variables from the medical history that were significantly associated with DU may reflect some patients’ natural history. For example, previous surgery could affect pelvic innervation and decrease bladder function and sensation. Also, the association of DU with prior BOO surgery may be due to preoperatively present DU, contributing to the overall clinical picture. Any retrospective look at such patients would find some patients with persisting symptoms due to unmasked DU.
The strengths of this analysis are that the urodynamic technique and structure of the interview were similar throughout the period and that data covering a large number of patients were used. A limitation is that the database is not a reflection of the general urological patient population, nor of the normal population in general, since all patients were referred for specialist evaluation of functional urological problems and many had received prior diagnosis and/or intervention. This was a retrospective, post hoc analysis of an existing database. A nonvalidated, although constant, set of questions were used and many data points were derived from clinician recording of patient responses to questions, and the potential for bias in the reported rates of underlying symptoms within each group cannot be discounted. The percentage of patients showing certain derived variables (see Materials and methods section) may have differed if patients had been directly asked if they experienced the symptom. Additionally, there are inherent limitations caused by the testing of multiple groups and endpoints. Notwithstanding these limitations, the analysis shows that there appears to be differences in signs and symptoms between DU patients in comparison with BOO patients and patients with normal PFS, which can be used to create instruments used to evaluate the results of treatments for UAB/DU.
Whilst patients in the normal PFS group were required to have a bladder voiding efficiency (BVE = volume voided/[volume voided + post void residual volume] × 100%) of 100%, a cut-off of 90% was used to distinguish between DU and BOO. Some studies have used BVE <60% as indicative of DU. The results did not differ greatly when comparing the symptom patterns of DU patients using cut-offs of 60%, 70%, 80%, and 90%. We therefore feel that it is legitimate to use BVE <90% as the criterion for DU, and BVE ≥90% for BOO patients in order to clearly differentiate the groups. Although there would be obstructed patients with a BVE <90%, to have incorporated these patients in the analysis would potentially have masked true differences in symptom patterns due to patients with both DU and BOO.
The observations in this study suggest that further work to develop a specific symptom questionnaire to assess DU severity, possibly coupled with noninvasive tests, could be useful for diagnosis, assessment, and evaluation of treatment outcomes. The importance of the development of noninvasive methods to characterise DU has been highlighted by several authors [2], [4], [8], [9], and [10]. Further analyses of this database, including flow and voiding parameters that may be relevant to the definition of DU [3], are planned.
The present study has demonstrated the utility of database analysis to aid the development of a symptom-based definition of a traditionally invasively diagnosed urological condition. The identification and diagnosis of UAB patients has currently been hampered by a poor understanding of the clinical presentation of DU and the necessity of invasive PFS. The present study has shown that there are signs and symptoms that can distinguish men and women DU patients from patients with normal PFS, and further distinguish between DU and BOO. This analysis is a first step to better understand the clinical presentation of DU patients, is consistent with the recently published UAB working definition [1], and justifies developing and testing a diagnostic algorithm based on the signs and symptoms of DU.
Author contributions: Andrew Gammie had full access to all the data in the study and takes responsibility for the integrity of the data and the accuracy of the data analysis.
Study concept and design: Gammie, Kaper, Dorrepaal, Kos, Abrams.
Acquisition of data: Gammie.
Analysis and interpretation of data: Gammie, Kaper, Dorrepaal, Kos, Abrams.
Drafting of the manuscript: Gammie, Abrams.
Critical revision of the manuscript for important intellectual content Gammie, Kaper, Dorrepaal, Kos, Abrams.
Statistical analysis: Kaper.
Obtaining funding: None.
Administrative, technical, or material support: None.
Supervision: None.
Other: None.
Financial disclosures: Andrew Gammie certifies that all conflicts of interest, including specific financial interests and relationships and affiliations relevant to the subject matter or materials discussed in the manuscript (eg, employment/affiliation, grants or funding, consultancies, honoraria, stock ownership or options, expert testimony, royalties, or patents filed, received, or pending), are the following: Kaper, Dorrepaal, and Kos are employees of Astellas Pharma Europe.
Funding/Support and role of the sponsor: Gammie and Abrams were supported for this analysis by a grant from Astellas Pharma Europe.
Acknowledgments: Analysis work was funded by Astellas Pharma Europe, who also contributed to the design of the study, analysis of the data, and preparation and review of the manuscript.
The clinical diagnosis of detrusor underactivity (DU) is hampered by the need for invasive pressure flow studies (PFS) and a lack of knowledge of the associated signs and symptoms. This has contributed to a lack of awareness of DU and its clinical correlate, underactive bladder (UAB) [1]. In consequence, this condition has been neglected compared with other causes of lower urinary tract symptoms. A recent review [2] concluded that DU “is surrounded by ambiguity” and recognises the limitations of the current definition. The International Continence Society defines DU as “a contraction of reduced strength and/or duration, resulting in prolonged bladder emptying and/or a failure to achieve complete bladder emptying within a normal time span” [3]. This, however, does not define “prolonged bladder emptying” or “normal time span”. Various methods have been proposed to determine contraction strength [2]; however, none of these take into account the duration of contraction – a key factor in the definition [3].
Despite this imprecision, estimates suggest that DU is a prevalent condition, ranging from 9% to 23% in men <50 yr, increasing to as much as 48% in men >70 yr [2]. Elderly women show a DU prevalence ranging from 12% to 45% [2]. An analysis of the signs and symptoms associated with DU could potentially facilitate the diagnosis of patients with UAB, improve our knowledge of the epidemiology, indicate possible noninvasive diagnostic approaches, and facilitate the development and evaluation of treatment outcomes of new therapies for UAB [4].
The aim of this study was to investigate the signs and symptoms recorded in a large database of patients referred for urological evaluation who met strictly defined PFS criteria for DU, bladder outlet obstruction (BOO) or normal, in order to identify the clinical features associated with DU.
Data from patients who underwent PFS, studied in a single specialist centre between 1985 and 2012, were recorded in a database that used the same variable fields throughout the 28-yr period.
Data gathering included patient interview to obtain symptoms and medical history, bladder diary data, physical examination, urodynamic studies, and diagnostic conclusions. PFS were carried out according to International Continence Society guidelines current at the time of testing. Free flow uroflowmetry was performed before each PFS. Postvoid residual urine volume was based on the volume obtained with catheterisation before filling commenced. The data from each PFS were screened for artefacts and manually entered into the database, thus avoiding automated data extraction errors. Prior to analysing the data, impossible values were removed in order to reduce corruption of data by manual entry errors. Several categorical (yes/no) variables used in the analysis were derived from a combination of database entry fields. For example, additional variables for straining and for decreased sensation were derived by combining the number of patients who reported these as symptoms with the number of patients for whom these were noted during PFS.
Patients without full voiding data, with neurological diseases affecting the lower urinary tract such as multiple sclerosis, paraplegia, or Parkinson's disease, and/or with a urodynamic diagnosis of detrusor overactivity were excluded as these require special consideration [5]. This resulted in 9928 eligible patient records (men: 1639; women: 8289) without confounding causes of vesico-urethral dysfunction (Fig. 1).
In order to classify patients with pure DU, BOO, or normal PFS, very strict criteria were used to avoid overlap. The criterion values were based on expert opinion and are shown in Table 1, which are in line with other studies cited by Osman et al [2]. A normal group was composed of patients with PFS judged to be normal, taking no medication related to bladder or urethra, and (for women) no clinical obstruction. Men who had both a low bladder contractility index and a high BOO index, suggesting simultaneous DU and BOO, were excluded from the analysis. Women patients with clinical obstruction, defined as urethral/bladder neck obstruction and/or large cystocoele or prolapse through the introitus, were also excluded from the DU and normal groups. Using these criteria, 1788 patient records (men: 507; women: 1281) were classified to DU, BOO, or normal PFS groups and used in the analysis (Fig. 1).
Table 1 Inclusion criteria used for patient grouping
| Men | Women | ||||||
|---|---|---|---|---|---|---|---|
| Group | BCI | BOOI | BVE % | pdetQmax | Qmax | BVE % | Excluding COb |
| DU | <100 | <20 | <90 | <20 | <15 | <90 | X |
| BOO | ≥100 | ≥40 | ≥90 | ≥40 | <12 | ≥90 | |
| Normal PFSa | ≥100 | <20 | 100 | ≥20 | ≥20 | 100 | X |
a A normal pressure flow study is a test with no abnormal pressure flow study findings and no present medication use related to bladder or urethra, in addition to the criteria listed.
b Clinical obstruction for women patients was considered as the clinician recording either a urethral or bladder neck obstruction during a video urodynamic test or a large cystocoele or prolapse through the introitus on examination.
BCI = bladder contractility index; BVE = bladder voiding efficiency; BOO = bladder outlet obstruction; BOOI = Bladder Outlet Obstruction Index; CO = clinical obstruction; DU = detrusor underactivity; pdetQmax = detrusor pressure at maximum flow rate; Qmax = maximum flow rate; PFS = pressure flow studies.
For all variables, the primary question was whether there was a difference in the reported values (numerical variables) or percentage of patients who reported a variable (categorical variables) for patients with DU compared with those with BOO or normal PFS.
For categorical variables, descriptive statistics for the number and percentage of patient records in each category were tabulated by patient group. Logistic regression models including patient group and age as factors were used for each binary variable. A p value for the hypothesis test that the odds ratio for each pair-wise comparison (DU vs BOO; DU vs normal PFS) was equal to 1 are provided with 95% confidence intervals. For example, a variable with an odds ratio for DU/BOO of 4.5 suggests that, after adjusting for age, the odds of a DU patient reporting the symptom are 4.5 times higher than for a patient with BOO. For cases where zero patients reported a variable outcome (ie, yes or no) in at least one group, estimates were obtained using exact logistic regression.
For numerical variables, descriptive statistics for the number of patients, median, and interquartile range (Q1–Q3) were summarised. PFS variables that were used to classify patients into groups (Table 1) were excluded from the analysis. Due to several variables appearing to be not normally distributed, a separate rank analysis of covariance model using patient group as factor and age as covariate was used for each pair-wise comparison (DU vs BOO; DU vs normal PFS). The rank analysis of covariance was utilised for hypothesis testing and p values were calculated from a mean score test comparing the groups using the values of the residuals as scores. No multiplicity adjustments were performed in this exploratory analysis which aimed to generate rather than confirm hypotheses. Future studies aimed at confirming hypotheses would, however, make these adjustments.
Age for men and women DU patients was statistically significantly higher compared with patients with normal PFS (median values: men 63 yr vs 55 yr; women 59 yr vs 44 yr). Age for women with DU was statistically significantly higher compared with women with BOO (median, 59 yr vs 44 yr). There were no significant differences in height, weight, or body mass index between the groups.
Table 2 and Table 3 show the odds ratios and corresponding 95% confidence intervals for categorical variables that showed a statistically significant difference between DU patients and at least one other group (p < 0.05). Table 4 gives a summary of medians and interquartile ranges for numerical variables that had statistically significant differences between DU patients and at least one other group. Supplementary Table 6 details all variables included in the analysis, so it may be deduced which variables were not statistically significantly different between groups by their absence from other tables.
Table 2 Men: odds ratios and 95% confidence intervals for categorical variables of detrusor underactivity compared with bladder outlet obstruction and normal pressure flow studies, using logistic regression model with patient group and age as factors
| Variable | Males, n (%) | ||||
|---|---|---|---|---|---|
| DU (n = 129) |
BOO (n = 256) |
Normal (n = 122) |
OR (CI) for DU/BOO | OR (CI) for DU/Normal | |
| Signs and symptoms | |||||
| Urinary stream decreased | 55 (56%) | 150 (82%) | 28 (30%) | 0.31*** (0.18, 0.54) |
3.02** (1.65, 5.56) |
| Hesitancy | 47 (51%) | 126 (69%) | 25 (26%) | 0.47** (0.28, 0.80) |
3.27** (1.74, 6.15) |
| Abnormal sexual function | 30 (41%) | 34 (26%) | 21 (29%) | 2.32* (1.20, 4.48) |
1.20 (0.55, 2.58) |
| Feeling of incomplete bladder emptying | 37 (36%) | 55 (29%) | 22 (22%) | 1.29 (0.77, 2.16) |
2.16* (1.14, 4.08) |
| Urgency, fear of leakage | 31 (30%) | 83 (45%) | 35 (35%) | 0.54* (0.32, 0.90) |
0.76 (0.42, 1.38) |
| Stress incontinence | 17 (25%) | 4 (3.7%) | 16 (22%) | 9.14** (2.91, 28.7) |
1.05 (0.48, 2.33) |
| Enuresis | 15 (21%) | 2 (1.8%) | 15 (21%) | 13.7** (3.02, 62.3) |
1.12 (0.46, 2.55) |
| Urinary stream interrupted | 19 (19%) | 20 (11%) | 9 (9.2%) | 1.88 (0.95, 3.72) |
2.42* (1.02, 5.73) |
| Palpable bladder | 13 (14%) | 1 (0.6%) | 1 (1.1%) | 28.0** (3.60, 218.1) |
13.5* (1.71, 106.5) |
| Absent or decreased sensation | 13 (13%) | 3 (3.0%) | 36.0 ***,a (7.47, ∞) |
4.57* (1.24, 16.9) |
|
| Bowel function – strains | 9 (11%) | 4 (2.4%) | 5 (5.6%) | 4.98** (1.48, 16.8) |
1.73 (0.54, 5.51) |
| Feeling of incomplete bowel emptying | 7 (8.6%) | 1 (0.6%) | 15.2* (1.83, 126.2) |
10.2*,a (1.93, ∞) |
|
| Always strains to void | 8 (8.0%) | 1 (0.5%) | 13.5* (1.63, 111.8) |
15.6**,a (2.95, ∞) |
|
| Bowel function: poor control or urgency | 5 (5.4%) | 1 (0.6%) | 5 (5.4%) | 9.84* (1.13, 85.8) |
1.08 (0.29, 4.02) |
| Medical history | |||||
| TURP surgeryb | 36 (72%) | 2 (5.9%) | 28 (60%) | 75.3*** (13.8, 410.4) |
1.38 (0.48, 3.93) |
| Bladder outlet obstruction surgeryb | 52 (51%) | 4 (2.3%) | 35 (36%) | 63.1*** (20.9, 189.9) |
1.26 (0.65, 2.43) |
| Any retentionc | 39 (39%) | 9 (4.9%) | 13 (14%) | 13.0*** (5.92, 28.4) |
3.63** (1.76, 7.47) |
| Surgery with possible denervation | 11 (30%) | 2 (5.7%) | 1 (3.2%) | 4.91 (0.95, 25.5) |
20.4** (2.17, 191.5) |
| Reported history of ≥1 UTI | 29 (28%) | 25 (14%) | 21 (21%) | 2.52** (1.38, 4.61) |
1.50 (0.78, 2.89) |
| Spontaneous retentionc | 21 (20%) | 4 (2.2%) | 9 (9.4%) | 11.6*** (3.87, 35.0) |
2.34 (1.00, 5.48) |
| Chronic retentionc | 14 (14%) | 1 (0.5%) | 29.2** (3.78, 226.0) |
17.5**,a (3.60, ∞) |
|
| Present drug use – antibiotics | 8 (8.3%) | 4 (2.4%) | 1 (1.1%) | 3.56* (1.03, 12.3) |
10.2* (1.20, 86.8) |
| Present drug use – antidepressants | 6 (6.2%) | 6 (3.5%) | 1.65 (0.51, 5.38) |
10.8*,a (1.92, ∞) |
|
| Invasive measurements – pressure flow studies | |||||
| Reduced filling phase sensation | 34 (28%) | 2 (0.9%) | 3 (2.5%) | 44.5*** (10.5, 189.4) |
17.3*** (5.05, 59.4) |
| Voids by straining | 20 (16%) | 64.8 ***,a (13.9, ∞) |
31.8 ***,a (6.79, ∞) |
||
| Detrusor contraction with strain | 12 (9.8%) | 2 (0.8%) | 1 (0.8%) | 12.8** (2.80, 58.0) |
12.6* (1.60, 99.7) |
| Combined variables (symptoms reported by patient and/or noted during invasive measurement) | |||||
| Decreased sensation | 42 (40%) | 2 (1.1%) | 6 (6.2%) | 59.6*** (14.0, 253.5) |
10.9*** (4.28, 27.8) |
| Straining | 37 (37%) | 3 (1.6%) | 1 (1.0%) | 35.5*** (10.6, 119.2) |
54.5** (7.25, 409.3) |
* indicates that the difference from the detrusor underactivity group was significant for p < 0.05.
** indicates that the difference from the detrusor underactivity group was significant for p < 0.01.
*** indicates that the difference from the detrusor underactivity group was significant for p < 0.0001.
a For cases where zero patients reported a variable outcome in at least one group, estimates were obtained using exact logistic regression which provides median unbiased estimates for odds ratios and sets upper 95% confidence interval values equal to infinity (∞).
b Patients could report up to two types of surgery. Bladder outlet obstruction surgery for men counts the number of patients who reported at least one of the following: transurethral resection of the prostate, radical perineal prostatectomy, bladder neck incision, or urethral dilatation.
c History of retention: patients could report up to two types of retention. Any retention counts the number of men who reported at least one of the following: acute retention after operation, chronic retention, or spontaneous retention.
BOO = bladder outlet obstruction; CI = confidence interval; DU = detrusor underactivity; OR = odds ratio; PFS = pressure flow studies; UTI = urinary tract infection.
Only variables with a statistically significant result for any group versus detrusor underactivity are included, for economy of space.
An odds ratio, for example, of 4.5 for detrusor underactivity/bladder outlet obstruction suggests that after adjusting for age, the odds of a detrusor underactivity patient reporting the symptom are 4.5 times higher than for a patient with BOO. Table 2 presents variables in descending order of frequency for the detrusor underactivity group. Percentages of patients reporting a symptom are based on total number of patients with non-missing data to derive a yes or no response. For economy of space, only the % of patients who reported ‘yes’ are displayed.
Table 3 Women: odds ratios and 95% confidence intervals for categorical variables of detrusor underactivity compared with bladder outlet obstruction and normal pressure flow studies, using logistic regression model with patient group and age as factors
| Variable | Women, n (%) | ||||
|---|---|---|---|---|---|
| DU (n = 308) |
BOO (n = 119) |
Normal (n = 854) |
OR (CI) for DU/BOO | OR (CI) for DU/Normal | |
| Signs and symptoms | |||||
| Stress incontinence | 203 (79%) | 61 (66%) | 656 (81%) | 1.91* (1.11, 3.28) |
0.87 (0.60, 1.28) |
| Urinary stream decreased | 75 (29%) | 21 (20%) | 32 (4.0%) | 1.81* (1.00, 3.25) |
10.8*** (6.56, 17.7) |
| Hesitancy | 78 (28%) | 29 (27%) | 75 (9.1%) | 1.01 (0.59, 1.71) |
3.71*** (2.49, 5.52) |
| Feeling of incomplete bladder emptying | 78 (28%) | 39 (36%) | 160 (20%) | 0.70 (0.43, 1.15) |
1.62** (1.14, 2.29) |
| Mobility impaired | 32 (13%) | 4 (4.3%) | 19 (2.8%) | 1.51 (0.49, 4.62) |
1.98* (1.00, 3.91) |
| Enuresis | 31 (12%) | 5 (5.3%) | 68 (8.4%) | 3.21* (1.18, 8.75) |
1.98** (1.19, 3.28) |
| Urinary stream interrupted | 32 (12%) | 10 (9.2%) | 9 (1.1%) | 1.22 (0.55, 2.73) |
10.9*** (4.81, 24.6) |
| Absent or decreased sensation | 12 (4.3%) | 7 (0.8%) | 8.56*,a (1.64, ∞) |
5.80** (1.99, 16.8) |
|
| Palpable bladder | 8 (3.3%) | 11 (1.5%) | 5.04a (0.89, ∞) |
3.34* (1.16, 9.60) |
|
| Medical history | |||||
| Reported history of ≥1 UTI | 112 (40%) | 41 (38%) | 242 (29%) | 1.24 (0.77, 2.01) |
1.83** (1.33, 2.50) |
| Any retentionb | 50 (19%) | 8 (7.5%) | 55 (6.8%) | 2.94** (1.30, 6.64) |
3.27*** (2.05, 5.22) |
| Acute retention after operation or childbirthb | 35 (13%) | 7 (6.6%) | 52 (6.4%) | 2.02 (0.84, 4.86) |
2.08** (1.24, 3.47) |
| Present drug use – diuretics | 33 (12%) | 3 (2.8%) | 25 (3.1%) | 2.40 (0.70, 8.31) |
1.99* (1.07, 3.71) |
| Present drug use – antidepressants | 31 (11%) | 3 (2.8%) | 4.34* (1.23, 15.4) |
149.0***,a (31.7, ∞) |
|
| Present drug use – antibiotics | 13 (4.8%) | 3 (2.8%) | 15 (1.8%) | 2.03 (0.53, 7.72) |
3.13** (1.33, 7.34) |
| Spontaneous retentionb | 11 (4.0%) | 1 (0.9%) | 3 (0.4%) | 6.01 (0.71, 50.9) |
15.2** (3.80, 60.9) |
| Surgery with possible denervation | 8 (3.3%) | 1 (1.0%) | 5 (0.6%) | 2.72 (0.31, 23.8) |
4.28* (1.18, 15.4) |
| Present drug use – oral contraceptives | 2 (0.7%) | 16 (15%) | 59 (7.3%) | 0.20* (0.04, 0.97) |
0.44 (0.10, 1.92) |
| Invasive measurements – Pressure flow studies | |||||
| Voids by straining | 55 (18%) | 1 (0.8%) | 3 (0.3%) | 24.7** (3.31, 183.5) |
59.2*** (17.7, 198.1) |
| Detrusor contraction with strain | 39 (13%) | 13 (11%) | 25 (2.9%) | 1.21 (0.60, 2.46) |
4.98*** (2.79, 8.90) |
| Reduced filling phase sensation | 35 (12%) | 3 (2.7%) | 15 (2.0%) | 4.87* (1.42, 16.7) |
6.67*** (3.33, 13.4) |
| After contraction | 4 (1.4%) | 19 (17%) | 191 (24%) | 0.09*** (0.03, 0.27) |
0.06*** (0.02, 0.16) |
| Combined variables (symptom reported by patient and/or noted during invasive measurement) | |||||
| Straining | 95 (34%) | 15 (14%) | 29 (3.5%) | 3.13** (1.67, 5.87) |
13.7*** (8.35, 22.3) |
| Decreased sensation | 42 (16%) | 3 (3.0%) | 22 (3.0%) | 5.40** (1.58, 18.4) |
5.28*** (2.88, 9.69) |
* indicates that the difference from the detrusor underactivity group was significant for p < 0.05.
** indicates that the difference from the detrusor underactivity group was significant for p < 0.01.
*** indicates that the difference from the detrusor underactivity group was significant for p < 0.0001.
a For cases where zero patients reported a variable outcome in at least one group, estimates were obtained using exact logistic regression which provides median unbiased estimates for odds ratios and sets upper 95% confidence interval values equal to infinity (∞).
b History of retention: patients could report up to two types of retention. Any retention counts the number of women who reported at least 1 of the following: acute retention after operation or childbirth, chronic or spontaneous retention.
BOO = bladder outlet obstruction; CI = confidence interval; DU = detrusor underactivity; OR = odds ratio; PFS = pressure flow studies; UTI = urinary tract infection.
Only variables with a statistically significant result for any group versus detrusor underactivity are included, for economy of space. An odds ratio, for example, of 4.5 for detrusor underactivity/bladder outlet obstruction suggests that after adjusting for age, the odds of a detrusor underactivity patient reporting the symptom are 4.5 times higher than for a patient with bladder outlet obstruction. Table 3 presents variables in descending order of frequency for the detrusor underactivity group. Percentages of patients reporting a symptom are based on total number of patients with non-missing data to derive a yes or no response. For economy of space, only the % of patients who reported ‘yes’ are displayed.
Table 4 Medians and interquartile ranges of numerical variables for detrusor underactivity compared with bladder outlet obstruction and normal pressure flow studies
| Variable | Statistic | Men | Women | ||||
|---|---|---|---|---|---|---|---|
| DU (n = 129) |
BOO (n = 256) | Normal (n = 122) | DU (n = 308) |
BOO (n = 119) | Normal (n = 854) | ||
| Medical History | |||||||
| Age at visit (yr) | n | 129 | 256 | 122 | 308 | 119 | 854 |
| Median | 63.0 | 63.0 | 55.5** | 59.0 | 44.0*** | 44.0*** | |
| Q1–Q3 | (49.0–72.0) | (56.0–69.0) | (40.0–68.0) | (49.0–71.0) | (37.0–56.0) | (36.0–52.0) | |
| Noninvasive measurements – bladder diary | |||||||
| Daytime micturitions | n | 86 | 167 | 84 | 247 | 100 | 758 |
| Median | 6.0 | 8.0** | 7.0 | 8.0 | 8.0 | 7.0** | |
| Q1 – Q3 | (5.0–8.0) | (6.0–9.0) | (5.0–9.5) | (7.0–10.0) | (6.0–10.0) | (6.0–9.0) | |
| Total nocturia episodes/24 h | n | 85 | 169 | 85 | 249 | 101 | 754 |
| Median | 1.0 | 2.0 | 1.0 | 1.5 | 1.0 | 0.5*** | |
| Q1–Q3 | (0.0–3.0) | (1.0–2.0) | (0.1–2.0) | (1.0–2.0) | (0.2–2.0) | (0.0–1.0) | |
| Max time (h) between daytime voids | n | 70 | 156 | 70 | 218 | 90 | 661 |
| Median | 4.0 | 3.0** | 4.0 | 3.0 | 3.0 | 3.5** | |
| Q1–Q3 | (3.0–5.0) | (2.5–4.0) | (2.5–5.0) | (2.0–4.0) | (2.0–4.0) | (3.0–4.5) | |
| Pads used in daytime | n | 17 | 3 | 10 | 150 | 32 | 335 |
| Median | 3.0 | 1.0 | 2.5 | 3.0 | 2.0 | 2.0** | |
| Q1–Q3 | (1.0–3.0) | (0.0–4.0) | (2.0–3.0) | (2.0–4.0) | (1.0–3.5) | (1.0–3.0) | |
| Pads used at night | n | 16 | 2 | 9 | 118 | 30 | 278 |
| Median | 1.0 | 1.0 | 0.0 | 1.0 | 0.0 | 0.0* | |
| Q1–Q3 | (1.0–1.0) | (1.0–1.0) | (0.0–1.0) | (0.0–1.0) | (0.0–1.0) | (0.0–1.0) | |
| Invasive measurements – pressure flow studies | |||||||
| Bladder volume at first desire (ml) | n | 114 | 230 | 120 | 282 | 115 | 812 |
| Median | 350 | 180*** | 280** | 230 | 200* | 280*** | |
| Q1–Q3 | (200–500) | (130–240) | (190–360) | (160–330) | (140–270) | (210–370) | |
| Volume at urgent desire (ml) | N | 19 | 66 | 33 | 57 | 33 | 202 |
| Median | 380 | 260** | 400 | 260 | 280 | 400*** | |
| Q1–Q3 | (220–610) | (200–310) | (250–440) | (180–340) | (190–330) | (310–500) | |
| Volume when leakage occurs (ml) | N | 16 | 2 | 10 | 171 | 23 | 309 |
| Median | 240 | 30** | 250 | 330 | 310 | 440*** | |
| Q1–Q3 | (180–290) | (20–50) | (200–350) | (250–400) | (260–390) | (350–540) | |
| Cystometric capacity (ml) | N | 129 | 256 | 122 | 308 | 119 | 854 |
| Median | 500 | 300*** | 440** | 360 | 320** | 450*** | |
| Q1–Q3 | (320–690) | (240–360) | (350–520) | (290–460) | (260–400) | (370–540) | |
| Compliance (ml/cmH2O) | N | 119 | 213 | 115 | 275 | 113 | 823 |
| Median | 125 | 89 | 157* | 205 | 154 | 258** | |
| Q1–Q3 | (50–287) | (49–254) | (75–426) | (86–310) | (68–252) | (99–390) | |
| Abdominal pressure at Qmax (cmH20) | N | 127 | 256 | 122 | 307 | 119 | 850 |
| Median | 55 | 40*** | 40*** | 36 | 22*** | 25*** | |
| Q1–Q3 | (40–75) | (32–46) | (32–45) | (25–51) | (15–35) | (17–32) | |
| Volume voided (ml) | N | 129 | 256 | 122 | 308 | 119 | 854 |
| Median | 230 | 290*** | 440*** | 200 | 310*** | 450*** | |
| Q1–Q3 | (130–360) | (250–360) | (340–520) | (130–290) | (260–390) | (370–540) | |
* indicates difference from detrusor underactivity group was significant for p < 0.05.
** indicates difference from detrusor underactivity group was significant for p < 0.01.
*** indicates difference from detrusor underactivity group was significant for p < 0.0001.
Q1 = 25th percentile; Q3 = 75th percentile; BOO = bladder outlet obstruction; DU = detrusor underactivity; PFS = pressure flow studies.
The p-values were derived using mean score test on residuals from rank analysis of covariance model with patient group as factor and age as covariate. A p-value for age at visit is taken from Wilcoxon rank sum test, as analysis of covariance cannot include age as both response variable and covariate.
The primary group comparisons of interest were DU versus BOO in men (the most difficult clinical differential diagnosis) and DU versus normal PFS in women. These comparisons are therefore described below and are all adjusted for age.
Refer to Supplementary Figure 2 (men) and Figure 3 (women) of forest plots and Table 5 showing symptoms with statistically significant differences for patients with DU compared with those with normal PFS or BOO.
Table 5 Summary of symptoms with statistically significant differences reported for patients with detrusor underactivity compared with those with normal pressure flow studies or with bladder outlet obstruction
| Men | Women | ||
|---|---|---|---|
| Higher occurrence for DU vs normal PFS |
Higher occurrence for DU vs BOO |
Higher occurrence for DU vs normal PFS |
Higher occurrence for DU vs BOO |
| Decreased urinary stream | Abnormal sexual function | Decreased urinary stream | Decreased urinary stream |
| Interrupted urinary stream | Stress incontinence | Interrupted urinary stream | Stress incontinence |
| Hesitancy | Enuresis | Hesitancy | Enuresis |
| Incomplete bladder emptying | Palpable bladder | Incomplete bladder emptying | Absent and/or decreased sensation |
| Palpable bladder | Absent and/or decreased sensation | Palpable bladder | |
| Absent and/or decreased sensation | Always strain to void | Absent and/or decreased sensation | |
| Always strain to void | Bowel strain | Enuresis | |
| Incomplete bowel emptying | Incomplete bowel emptying | Impaired mobility | |
| Poor bowel control | |||
| Lower occurrence for DU vs normal PFS |
Lower occurrence for DU vs BOO |
Lower occurrence for DU vs normal PFS |
Lower occurrence for DU vs BOO |
|---|---|---|---|
| None | Decreased urinary stream | None | None |
| Hesitancy | |||
| Urgency |
BOO = bladder outlet obstruction; DU = detrusor underactivity; PFS = pressure flow studies.
Men with DU reported a statistically significantly higher occurrence of decreased and/or interrupted urinary stream, hesitancy, feeling of incomplete bladder emptying, palpable bladder, feeling of incomplete bowel emptying, absent and/or decreased sensation, and always straining to void compared with men with normal PFS. Men with DU reported a statistically significantly higher occurrence of abnormal sexual function, stress incontinence, enuresis, palpable bladder, absent and/or decreased sensation, always straining to void, bowel straining, feeling of incomplete bowel emptying, and poor bowel control compared with men with BOO. A statistically significant lower occurrence of decreased urinary stream, hesitancy, and urgency was reported for men with DU compared with men with BOO.
Women with DU reported a statistically significantly higher occurrence of decreased and/or interrupted urinary stream, hesitancy, feeling of incomplete bladder emptying, palpable bladder, absent and/or decreased sensation, enuresis, and impaired mobility compared with women with normal PFS.
Men with DU reported a statistically significantly higher occurrence of retention, surgery with possible denervation of bladder and/or bowel, and use of antibiotics and/or antidepressants compared with men with normal PFS. Men with DU reported a statistically significantly higher occurrence of BOO surgery, retention, one or more urinary tract infections, and use of antibiotics compared with men with BOO.
Women with DU reported a statistically significantly higher occurrence of retention, surgery with possible denervation of bladder and/or bowel, one or more urinary tract infections, and use of antidepressants, antibiotics, and/or diuretics compared with women with normal PFS.
Men with DU reported a statistically significantly higher occurrence of reduced filling phase sensation, detrusor contraction with strain, and voiding by straining compared with men with normal PFS or BOO.
Men with DU reported statistically significantly higher values for bladder volume at first desire to void, cystometric capacity, and abdominal pressure at Qmax compared with men with normal PFS, but statistically significantly lower values for bladder compliance and volume voided. Men with DU reported statistically significantly higher values for bladder volumes at first and urgent desire to void, when leakage occurred, and at cystometric capacity, and abdominal pressure at Qmax compared with men with BOO, but statistically significantly lower values for volume voided.
Women with DU reported a statistically significantly higher occurrence of reduced filling phase sensation, detrusor contraction with strain, and voiding by straining compared with women with normal PFS, but a statistically significantly lower occurrence of after contraction.
Women with DU reported a statistically significantly higher value for abdominal pressure at Qmax compared with women with normal PFS, but statistically significantly lower values for bladder volumes at first and urgent desire to void, when leakage occurred, and at cystometric capacity, for volume voided, and for bladder compliance.
Men and women with DU reported a statistically significantly higher occurrence of both decreased sensation and straining compared with patients with normal PFS or BOO.
Men with DU reported a statistically significantly higher value for maximum time between voids and a statistically significantly lower value for number of daytime micturitions compared with BOO patients.
Women with DU reported a statistically significantly higher value for daytime micturitions, nocturia episodes, and day and night time pad use compared with women with normal PFS, but a statistically significantly lower value for maximum time between voids.
This study shows that cross-sectional data can be used to associate signs and symptoms with urodynamically-defined DU.
Two earlier studies failed to detect clear differences in clinical presentation of DU patients compared with other patients, and concluded that few symptoms were helpful [6] and [7], whereas this study and another recent report in women by Rademakers et al [8] used strict criteria and a wide range of symptoms.
The present study corroborated Rademakers et al's [8] findings of an increased prevalence of incomplete bladder emptying, hesitancy, and a weak stream in women with DU compared with women with normal PFS. Some variables from the medical history that were significantly associated with DU may reflect some patients’ natural history. For example, previous surgery could affect pelvic innervation and decrease bladder function and sensation. Also, the association of DU with prior BOO surgery may be due to preoperatively present DU, contributing to the overall clinical picture. Any retrospective look at such patients would find some patients with persisting symptoms due to unmasked DU.
The strengths of this analysis are that the urodynamic technique and structure of the interview were similar throughout the period and that data covering a large number of patients were used. A limitation is that the database is not a reflection of the general urological patient population, nor of the normal population in general, since all patients were referred for specialist evaluation of functional urological problems and many had received prior diagnosis and/or intervention. This was a retrospective, post hoc analysis of an existing database. A nonvalidated, although constant, set of questions were used and many data points were derived from clinician recording of patient responses to questions, and the potential for bias in the reported rates of underlying symptoms within each group cannot be discounted. The percentage of patients showing certain derived variables (see Materials and methods section) may have differed if patients had been directly asked if they experienced the symptom. Additionally, there are inherent limitations caused by the testing of multiple groups and endpoints. Notwithstanding these limitations, the analysis shows that there appears to be differences in signs and symptoms between DU patients in comparison with BOO patients and patients with normal PFS, which can be used to create instruments used to evaluate the results of treatments for UAB/DU.
Whilst patients in the normal PFS group were required to have a bladder voiding efficiency (BVE = volume voided/[volume voided + post void residual volume] × 100%) of 100%, a cut-off of 90% was used to distinguish between DU and BOO. Some studies have used BVE <60% as indicative of DU. The results did not differ greatly when comparing the symptom patterns of DU patients using cut-offs of 60%, 70%, 80%, and 90%. We therefore feel that it is legitimate to use BVE <90% as the criterion for DU, and BVE ≥90% for BOO patients in order to clearly differentiate the groups. Although there would be obstructed patients with a BVE <90%, to have incorporated these patients in the analysis would potentially have masked true differences in symptom patterns due to patients with both DU and BOO.
The observations in this study suggest that further work to develop a specific symptom questionnaire to assess DU severity, possibly coupled with noninvasive tests, could be useful for diagnosis, assessment, and evaluation of treatment outcomes. The importance of the development of noninvasive methods to characterise DU has been highlighted by several authors [2], [4], [8], [9], and [10]. Further analyses of this database, including flow and voiding parameters that may be relevant to the definition of DU [3], are planned.
The present study has demonstrated the utility of database analysis to aid the development of a symptom-based definition of a traditionally invasively diagnosed urological condition. The identification and diagnosis of UAB patients has currently been hampered by a poor understanding of the clinical presentation of DU and the necessity of invasive PFS. The present study has shown that there are signs and symptoms that can distinguish men and women DU patients from patients with normal PFS, and further distinguish between DU and BOO. This analysis is a first step to better understand the clinical presentation of DU patients, is consistent with the recently published UAB working definition [1], and justifies developing and testing a diagnostic algorithm based on the signs and symptoms of DU.
Author contributions: Andrew Gammie had full access to all the data in the study and takes responsibility for the integrity of the data and the accuracy of the data analysis.
Study concept and design: Gammie, Kaper, Dorrepaal, Kos, Abrams.
Acquisition of data: Gammie.
Analysis and interpretation of data: Gammie, Kaper, Dorrepaal, Kos, Abrams.
Drafting of the manuscript: Gammie, Abrams.
Critical revision of the manuscript for important intellectual content Gammie, Kaper, Dorrepaal, Kos, Abrams.
Statistical analysis: Kaper.
Obtaining funding: None.
Administrative, technical, or material support: None.
Supervision: None.
Other: None.
Financial disclosures: Andrew Gammie certifies that all conflicts of interest, including specific financial interests and relationships and affiliations relevant to the subject matter or materials discussed in the manuscript (eg, employment/affiliation, grants or funding, consultancies, honoraria, stock ownership or options, expert testimony, royalties, or patents filed, received, or pending), are the following: Kaper, Dorrepaal, and Kos are employees of Astellas Pharma Europe.
Funding/Support and role of the sponsor: Gammie and Abrams were supported for this analysis by a grant from Astellas Pharma Europe.
Acknowledgments: Analysis work was funded by Astellas Pharma Europe, who also contributed to the design of the study, analysis of the data, and preparation and review of the manuscript.