Context
Although vital for decision-making about management, the natural history of nocturia remains uncertain. A systematic review would clarify the issue, but because natural history reviews are uncommon it would require methodological innovations.
Objective
To estimate the incidence and remission of nocturia, and refine methods for meta-analyses assessing natural history.
Evidence acquisition
We conducted a comprehensive search of PubMed, Scopus, and Cumulative Index of Nursing and Allied Health Literature databases and abstracts of major urologic meetings as far as August 31, 2015. Random effects meta-analyses addressed incidence/remission rates of nocturia; meta-regression explored potential determinants of heterogeneity. Studies were categorized as either low or high risk of bias using a novel instrument specifically designed for longitudinal symptom studies aimed at the general population.
Evidence synthesis
Of 4165 potentially relevant reports, 16 proved eligible. Pooled estimates from 13 studies (114 964 person-years of follow-up) demonstrated that annual incidence was strongly associated with age: 0.4% (0–0.8%) for adults aged < 40 yr; 2.8% (1.9–3.7%) for adults aged 40–59 yr; and 11.5% (9.1–14.0%) for adults aged ≥ 60 yr. Of those with nocturia, each year 12.1% (9.5–14.7%) experienced remission.
Conclusions
The available evidence suggests that nocturia onset is strongly associated with age, with much higher rates in those over 60 yr; remission occurs in approximately 12% each year. These estimates can aid with management decisions and counseling related to nocturia.
Patient summary
We reviewed all previous studies of progression of night-time urination (nocturia). We found that in any given year 0.4% of adults aged < 40 yr, 3% of adults aged 40–59 yr, and 12% of adults aged ≥ 60 yr will develop nocturia, while overall 12% of those with nocturia will improve. These findings may be helpful in making decisions about coping with or treating nocturia.
Nocturia (waking from sleep at night to void) [1] is one of the most common and bothersome urinary symptoms [2]. Nocturia is associated with impaired quality of life, and is a significant cause of sleep disruption. Nocturia may increase fracture and mortality risk [3] and [4]. Cross-sectional studies suggest that older age increases the risk of nocturia [5], and studies have identified additional risk factors, suggesting a multifactorial etiology [6]. Little is known, however, about patterns of progression and remission of nocturia over time, knowledge of which would facilitate shared decision-making about the initiation and continuation of therapeutic options between patients and healthcare providers [7].
Conventional systematic reviews that compare one treatment against another or against a nontreatment control are common and the methods are well established [8]. However, systematic reviews and meta-analyses addressing natural history or prognosis of symptoms are rare, and require methodological innovation. Although investigators have conducted longitudinal studies addressing nocturia, summarizing the data is challenging, with variation between assessment tools, case definitions, and analytic strategies [6]. The primary aim of this systematic review was to explore and compare, using different analytical methods and definitions, the average annual cumulative incidence and remission of nocturia. We also aimed to examine progression of nocturia, and further develop methods for systematic reviews and meta-analyses assessing natural history and prognosis of symptoms.
We registered the review protocol (PROSPERO: CRD42012001985), and followed the Preferred Reporting Items for Systematic reviews and Meta-Analyses guidance [9]. No ethical approval was required.
An experienced research librarian (M.A.) collaborated in planning the search strategy, performed up to 31 August, 2015, in PubMed (from 1946 to present), Scopus (1995 to present), and Cumulative Index of Nursing and Allied Health Literature (1960 to present) without search limits or language restrictions. As increasing evidence suggests the benefits of inclusion of grey literature to the systematic reviews [10], we also searched abstracts published in the annual meetings of the American Urological Association, European Association of Urology, International Continence Society, and International Urogynecological Association from the past 10 yr (2005–2015) for ongoing and unpublished studies. Supplementary Appendix 1 provides the search strategy. We also hand searched reference lists of all included articles.
We included longitudinal studies with a follow-up of at least 3 mo reporting the incidence, progression, remission, or change in prevalence in a primarily non-care seeking adult population. We excluded studies in which the aim was to assess the effect of any intervention, including those with untreated control arms. We also excluded studies assessing lower urinary tract symptoms (LUTS) in patients with any specific health disorder. Finally, we excluded studies assessing the impact of pregnancy or delivery on LUTS if the baseline LUTS assessment was carried out either during pregnancy or in the 1st postpartum year.
We developed standardized, pilot-tested forms together with detailed instructions for screening of abstracts and full texts, risk of bias assessments, and data extraction. The reviewers conducted pilot screening and data extraction exercises to achieve a high level of agreement. Pairs of reviewers, independently and in duplicate, screened study reports for eligibility, assessed risk of bias, and collected data from each eligible study. Reviewers resolved disagreements through discussions; one of two adjudicators resolved remaining disagreements.
When more than one report provided data from the same study, we used the most complete report, and additionally combined data from less complete reports where possible. We recorded the country/source of study sample, age and sex distribution, exclusion criteria used in individual studies, assessment tools used for nocturia, follow-up time, sample size including response rate, as well as incidence and remission rates of nocturia.
One challenge for a systematic review of symptom prognosis is that risk of bias criteria, as well as criteria for overall certainty in estimates, although well established for reviews of therapeutic trials, are controversial in observational studies [11]. Through iterative discussion and consensus building, and informed by prior literature [12] and [13], we developed a novel instrument to categorize studies as either low or high risk of bias, evaluating the representativeness of the source populations, accuracy of the outcome assessment, and the proportion of missing data (Supplementary Appendix 2) [14].
We used three different analytic definitions to assess the incidence of nocturia: (1) any new nocturia case (≥1 voids/night) at follow-up for individuals without nocturia at baseline, (2) any new case of ≥2 voids/night for individuals with no or one void per night at baseline, and (3) any new case of ≥3 voids/night for individuals with two or less voids per night at baseline. Similarly, we used three analytic definitions for nocturia remission: (1) one or more voids per night resolving to no nocturia, (2) two or more nocturia episodes resolving to no or one void per night, and (3) three or more nocturia episodes resolving to two or less voids per night. Epidemiological studies have suggested that difference of at least one void per night is patient-important [15] and [16].
For cumulative incidence and remission rates, person-years were calculated by multiplying the number of individuals without/with nocturia (for incidence and remission, respectively) at the follow-up by follow-up time (simple cumulative incidence methodology). Standard errors and 95% confidence intervals were calculated for natural logarithms of incidence/remission rates per 1000 person-years of follow-up. In the case of zero events, a correction of 0.5 was added to observed events and person-years to enable calculation of confidence intervals. Finally, we also used actuarial cumulative incidence methodology for sensitivity analyses (Supplementary Appendix 3).
We calculated pooled rates of incidence and remission of nocturia using the DerSimonian–Laird random effects inverse variance method. Rates were expressed as observed events per 1000 person-years of follow-up. If a study provided more than one definition for incidence/remission of nocturia, when pooling data, we preferred nocturia estimates using a definition of two or more voids/night. Analyses were also carried out for three age groups (18–39 yr, 40–59 yr, and 60 yr and over) as earlier research suggest substantial differences between individuals in young adulthood, middle age, and in older age [5]. Finally, we measured estimates stratified by sex and across the three nocturia case definitions (defined as ≥1, ≥2, or ≥3 voids/night).
We employed prespecified hypotheses to examine heterogeneity using meta-regression analysis weighted by the inverse of the variance in a random effects model. Separately for each nocturia case definition (≥1, ≥2, or ≥3 voids/night), we examined the following variables as potential sources of heterogeneity: (1) mean age, (2) sex distribution, (3) length of follow-up, and (4) risk of bias. For incidence, we had prespecified hypotheses that effect estimates would be higher for: (1) older age, (2) higher proportion of male population, (3) shorter follow-up time, and (4) lower risk of bias. For remission, we had prespecified hypotheses that effect estimates would be higher for: (1) younger age, (2) higher proportion of female population, (3) shorter follow-up time, and (4) lower risk of bias.
To illustrate the relation of nocturia incidence and remission with nocturia prevalence, we estimated the (baseline) prevalence of nocturia ≥1, ≥2 and ≥3 episodes/night using a previous comprehensive systematic review addressing the prevalence of nocturia [5].
We narratively summarized the studies on progression of nocturia but did not pool estimates because too few studies on progression were included in our meta-analysis. Statistical analyzes were performed using metan and metareg in Stata 12.1 (StataCorp, College Station, TX, USA) [17].
We screened 4165 abstracts and retrieved 74 full texts and two eligible conference abstracts (Fig. 1). Sixteen studies provided usable data from 15 142 men and 18 726 women (Table 1). From these 16 studies, two provided proportional measures of progression and remission of nocturia among all persons in follow-up but did not report actual number of incident or remitting cases [18] and [19]. Similarly, one study provided only periodic prevalences of nocturia but not data of incident or remitting cases [20]. We were therefore able to include 13 studies (114 964 person-years) in meta-analyses of incidence and remission rates of nocturia [21], [22], [23], [24], [25], [26], [27], [28], [29], [30], [31], [32], and [33].
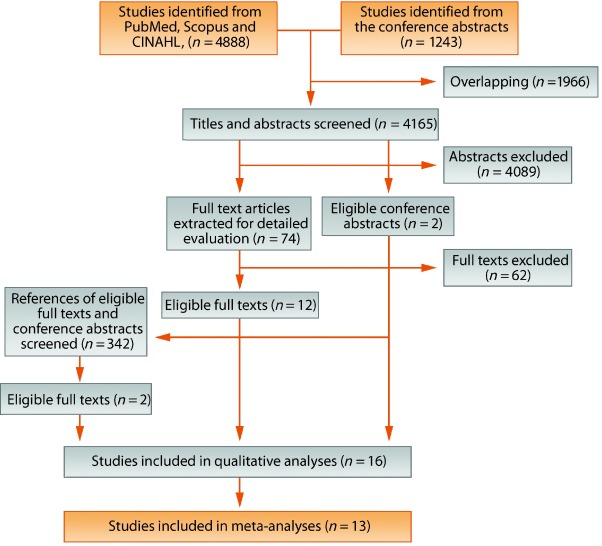
Table 1 Characteristics of the studies included in qualitative analyses
| Study | Country | Source of sample | Population characteristicsa | Exclusion criteria | Assessment tool for nocturia | Follow-up time (yr) | No. of contacted at the baseline | No. of eligible respondents | |
|---|---|---|---|---|---|---|---|---|---|
| Baseline | Follow-up | ||||||||
| Bulpitt et al 1976 [21][18] | England | GP registry | Both sex, 38% men, mean age 53 yr (range, 32–69 yr) | Hypertension | A symptom questionnaire for hypertensive patients (validated) | 0.8 | 173 | 88 (51%) | 55 (63%) |
| Lee et al 1998 [18]b | Scotland | GP registries | Men, mean age 56 yr (range, 40–79 yr) | Treatment/disease affecting lower urinary tract | AUA-SI | 5 | 3094 | 1994 (64%) | 1159 (58%) |
| Møller et al., 2000 [22] | Denmark | Civil registry | Women, mean age 50 yr (range, 40–60 yr) | None | BFLUTS | 1 | 4000 | 2860 (72%) | 2284 (80%) |
| Temml et al 2003 [19]b | Austria | Health screening | Men, mean age 55 yr (range, 40–84 yr) | Treatment affecting lower urinary tract | IPSS | 5 | 2096 | 854 (41%) | 456 (53.4%) |
| Johnson et al 2005 [23] | USA | Marketing list vendor | Both sex, 40.7% men, mean age 71yr (range, 60+ yr) | Institutionalized | MESA questionnaire (validated) | 1 | 1956 | 1632 (83%) | 1105 (68%) |
| Häkkinen et al 2006 [24] | Finland | Civil registry | Men, mean age 62 yr (range, 50–70 yr) | None | DAN-PSS | 5 | 3143 | 2198 (70%) | 1683 (77%) |
| Chen et al 2007 [25] | Taiwan | Health screening | Women, mean age 60 yr (range, 40–79 yr) | None | Unvalidated questionnaire | 2 | 1149 | 862 (75%) | 314 (36%) |
| Viktrup and Lose 2008 [26] | Denmark | Department of obstetrics | Primiparous women, mean age 35 yr (range, 17–41 yr)c | None | A questionnaire in accordance with definitions by ICS (validated) | 7 | Unclear | 305 | 226 |
| Wennberg et al 2009 [27] | Sweden | Civil registry | Women, mean age 56 yr (range, 20–98 yr) | None | IPSS | 16 | 2911 | 2248 (77%) | 1081 (37%) |
| Malmsten et al 2010 [20]b | Sweden | Civil registry | Men, mean age 62 yr (45–99 yr) | None | IPSS | 11 | 10458 | 7763 (74%) | 3257 (42%) |
| Heidler et al 2011 [28] | Austria | Health screening | Women, mean age 57 yr (range, 21–81 yr) | Urinary tract infection, surgery for urinary incontinence | BFLUTS | 6.5 | 1166 | 925 (79%) | 386 (42%) |
| Van Doorn et al 2011 [29] | The Netherlands | Civil registry | Men, mean age 62 yr (range, 50–78 yr) | Surgery/condition affecting lower urinary tract, poor health | FVC (frequency-volume chart) | 2.1 | 3398 | 1122 (33%) | 698 (62%) |
| Aoki et al 2012 [30] | Japan | Health screening | Both sex, 30.8% men, mean age 68 yr (range, 23–95 yr) | None | Unvalidated questionnaire | 4 | Unclear | 23 126 | 13 536 |
| Hunter et al 2012 [31] | USA | Home support registries | Women receiving home support, mean age 84 yr (range, 70–103 yr) | Poor health | ICIQ-FLUTS | 0.5 | 203 | 100 (49%) | 75 (75%) |
| Hirayama et al 2013 [32] | Japan | Health screening | Both sex, 50.7% men, mean age 73 yr (range, 65–93 yr) | Poor health, institutionalized | IPSS | 1 | 4427 | 3915 (88%) | 3685 (94%) |
| Araujo et al 2014 [33] | USA | Street lists | Both sex, 38.9% men, mean age 52 yr (range, 30–79 yr) | Poor health | AUA-SI | 5 | 9602 | 5502 (57%) | 4144 (75%) |
a Mean age at the midpoint of the follow-up; to estimate the mean age at the moment of nocturia incidence/remission in the study population, half of the duration of the follow-up time was added to the mean age at the baseline.
b Three studies were not included in the meta-analyses.
c Age information at the time of delivery. We used data from nocturia observations that were collected between the 7th and 12th postpartum years.AUA-SI = American Urological Association Symptom Index; BFLUTS = The Bristol Female Lower Urinary Tract Symptoms; DAN-PSS = The Danish Prostatic Symptom Score; ICIQ-FLUTS = International Consultation on Incontinence Questionnaire-Female Lower Urinary Tract Symptoms; ICS = International Continence Society; IPSS = International Prostate Symptom Score; MESA = Medical, Epidemiologic and Social Aspects of Aging questionnaire.
Table 1 provides a description of the 16 studies. Ten (62%) were conducted in Europe, three (19%) in North America, and three (19%) in Asia. The studies varied widely, including sex and age distributions, as well as in follow-up times (median 4.5 yr; range, 6 mo to 16 yr). Fifteen studies (94%) used symptom questionnaires and one (6%) used frequency-volume charts.
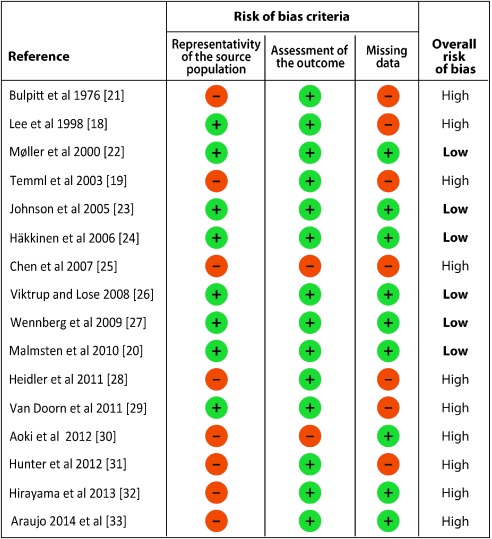
Of the 16 included studies, 10 (62%) were at high risk and six (38%) at low risk of bias (Fig. 2). Of these 16 studies, 14 (88%) accurately assessed nocturia both at baseline and at follow-up, nine (56%) had little missing data in the follow-up, and eight (50%) used representative source populations.
In meta-analyses of the incidence rates of nocturia (12 studies, five low and seven high risk of bias), the pooled average annual cumulative incidence was 4.9% (95% confidence interval 4.1–5.8, I2 = 98.6%; no difference between simple and actuarial cumulative incidence methodology; Fig. 3; Supplementary Fig. 1). With age stratification, annual incidence increased with increasing age: 0.4% (0–0.8%, I2 = 65.1%) for adults aged < 40 yr, 2.8% (1.9–3.7%, I2 = 98.1%) for adults aged 40–59 yr, and 11.5% (9.1–14.0%, I2 = 98.8%) for adults aged ≥ 60 yr (Fig. 3). Pooled incidence rates did not significantly differ by nocturia case definition (4.1% (3.0–5.2%) for ≥1 episode per night, 4.4% (3.6–5.2%) for ≥2 episodes per night, and 3.7% (2.4–5.1%) for ≥3 episodes per night; Supplementary Table 1).
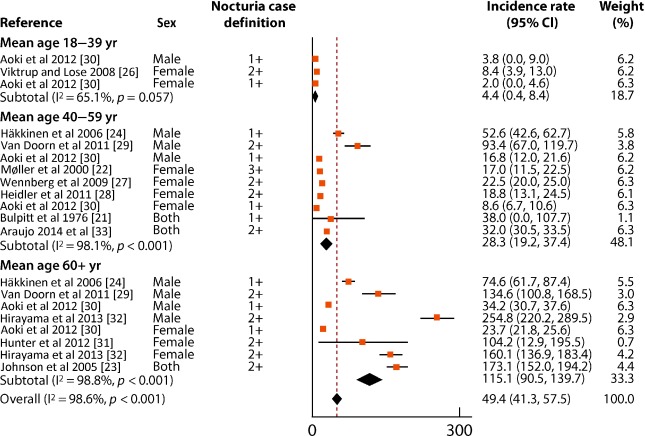
Fig. 3 Forest plot of incidence rates of nocturia per 1000 person-years of follow-up.CI = confidence interval.
In multivariable meta-regression, (borderline) significant predictor for higher incidence was older age (4.7% increase/decade for ≥1 voids/night, –1.4 to 10.8, p = 0.12, 2.5% increase/decade for ≥2 voids/night, 0.1–4.9, p = 0.04; and 2.6% increase/decade for ≥3 voids/night, –0.2 to 5.4, p = 0.06). Follow-up time, sex distribution, or risk of bias were not strongly suggestive of higher or lower incidence of nocturia (Supplementary Table 2).
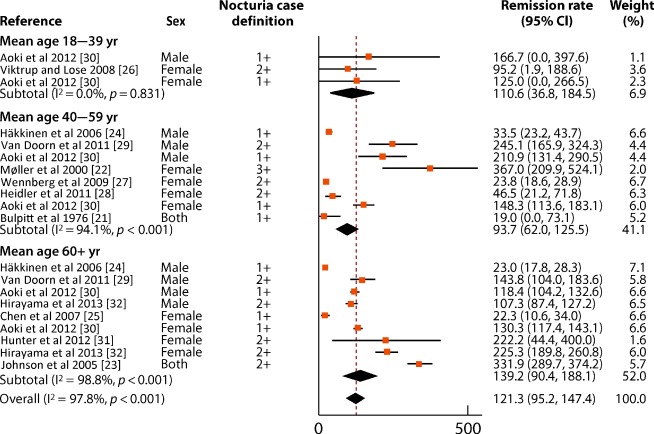
In meta-analyses of remission rates of nocturia (12 studies, five low and seven high risk of bias), the pooled average annual cumulative remission was 12.1% (9.5–14.7%, I2 = 97.8%; no difference between simple and actuarial cumulative remission methodology; Fig. 4; Supplementary Fig. 2). With age stratification, annual remission rates did not differ by age: 11.1% (3.7–18.5%, I2 = 0.0%) for adults aged < 40 yr, 9.4% (6.2–12.6%, I2 = 94.1%) for adults aged 40–59 yr, and 13.9% (9.0–18.8%, I2 = 98.8%) for adults aged ≥ 60 yr (Fig. 4). Pooled remission rates for nocturia increased with higher nocturia case definition: 6.7% (4.5–8.9%) for ≥1 voids/night, 15.5% (10.4–20.6%) for ≥2 voids/night, and 22.3% (13.2–31.3%) for ≥3 voids/night (Supplementary Table 1).
In multivariable meta-regression, age, sex distribution, follow-up time, or risk of bias were not consistently suggestive of higher or lower remission of nocturia (Supplementary Table 3).
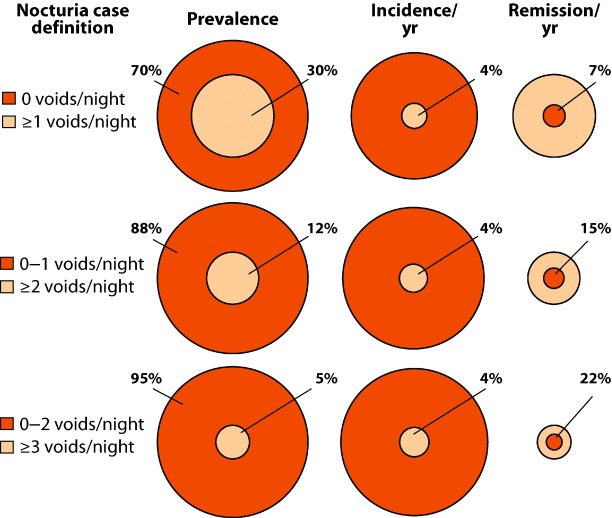
Figure 5 illustrates the relation of baseline prevalence (of having or not having nocturia) with (average annual) cumulative incidence and remission. For instance, baseline prevalence is 5% for ≥3 nocturia episodes. Therefore, 5% of population are “at risk” of nocturia remission and 95% are “at risk” of nocturia incidence. According to our meta-analyses (Supplementary Table 1), cumulative incidence is 3.7% (2.4–5.1%) and cumulative remission is 22.3% (13.2–31.3%) for ≥3 nocturia episodes. However, due to the baseline prevalence, indeed more incident than remittent nocturia cases emerge annually and the prevalence therefore grows with age (Fig. 5).
Three studies provided proportional measures for progression/remission of nocturia [18], [19], and [28]. In a Scottish study conducted among middle-aged and elderly men [18], progression of nocturia occurred in 40% and remission in 10%, whereas in 50% of men nocturia remained unchanged after 5-yr follow-up. In an Austrian study also conducted among middle-aged and elderly men [19], progression occurred in 28%, remission in 27%, while in 45% of men nocturia symptoms were unchanged. An Austrian study conducted among women of all adult ages [28], reported after 6.5-yr follow-up, progression from one void to at least two voids per night occurred in 21% of women with one void per night at the baseline, and remission to one void per night in 23% of women with at least two voids per night at the baseline.
To our knowledge, this is the first systematic review assessing the natural history of nocturia. The strengths of this review include a contemporary and comprehensive search of both published and unpublished studies without language restrictions, the duplicate assessment of eligibility and data extraction, and the appraisal of risk of bias. Although randomized trials provide estimates of treatment effect with the lowest risk of bias, populations enrolled are likely to differ from general populations in a variety of ways, making their application to general populations limited [34]. Hence, we chose to provide estimates from observational studies of unselected patients; such studies are likely to be the best source of estimates of prognosis. We used appropriate statistical methods to generate pooled estimates, followed a prespecified data analysis plan, and employed a limited number of important and plausible hypotheses to explore potential determinants of heterogeneity, and applied novel approaches to risk of bias assessment [14]. Finally, sensitivity analyses did not change results appreciably.
The limitations of our review are largely the weaknesses of the eligible studies. Firstly, included studies use several different instruments for assessment with different definitions of nocturia. Secondly, variation in follow-up times makes comparison of estimates for incidence and remission rates of nocturia challenging because of the fluctuating nature of this symptom [35]. Pooling the rates from studies with follow-up times varying from 6 mo to 16 yr (Table 1) necessarily involves some approximation when trying to estimate average annual incidence and remission. These studies have included some people with interventions and are therefore somewhat limited as not entirely representing the “natural” history. Another important limitation is the very wide differences between rates of both incidence and remission across studies, differences that could be partially explained by age. Differences in age distributions and follow-up times between male and female studies limited the comparability of the estimates between sexes. Finally, although identified studies include both men and women of all adult ages, there is paucity of studies including younger adults.
Besides being useful in counseling patients with nocturia, these results highlight the burden of nocturia among older men and women compared with younger adults. Those aged over 60 yr were nearly four times more likely to develop nocturia compared with adults aged 40–59 yr. Also, while one out of every eight persons with nocturia reported remission annually, for clinicians and patients, nocturia remains a challenging condition to treat [6] and [36]. With the aging of populations worldwide and the well-recognized negative health impact of frequent nocturia [15] and [37], development of novel treatment strategies that are well-tolerated should remain a research priority.
Our study summarizes the incidence and remission of nocturia in a general population using data from five low and eight high risk of bias studies. Across all available studies, the incidence of nocturia is 0.4% per year among adults aged < 40 yr, 2.8% among those aged 40–59 yr, and 11.5% among those aged ≥ 60 yr, while overall remission is 12.1% per year; estimates, however, varied considerably among studies. These estimates can aid with management decisions and counseling related to nocturia.
Author contributions: Kari A.O. Tikkinen had full access to all the data in the study and takes responsibility for the integrity of the data and the accuracy of the data analysis.
Study concept and design: Pesonen, Cartwright, Tikkinen.
Acquisition of data: Pesonen, Cartwright, Mangera, Santti, Griebling, Pryalukhin, Riikonen, Tähtinen, Agarwal, Tsui, Vaughan, Markland, Johnson, Fonsell-Annala, Khoo, Aoki, Tikkinen.
Analysis and interpretation of data: Pesonen, Cartwright, Auvinen, Heels-Ansdell, Guyatt, Tikkinen.
Drafting of the manuscript: Pesonen, Cartwright, Tikkinen.
Critical revision of the manuscript for important intellectual content: Pesonen, Cartwright, Mangera, Santti, Griebling, Pryalukhin, Riikonen, Tähtinen, Agarwal, Tsui, Vaughan, Markland, Johnson, Fonsell-Annala, Khoo, Tammela, Aoki, Auvinen, Heels-Ansdell, Guyatt, Tikkinen.
Statistical analysis: Pesonen, Cartwright, Heels-Ansdell, Guyatt, Tikkinen.
Obtaining funding: Tikkinen.
Administrative, technical, or material support: Tammela.
Supervision: Cartwright, Guyatt, Tikkinen.
Other: None.
Financial disclosures: Kari A.O. Tikkinen certifies that all conflicts of interest, including specific financial interests and relationships and affiliations relevant to the subject matter or materials discussed in the manuscript (eg, employment/affiliation, grants or funding, consultancies, honoraria, stock ownership or options, expert testimony, royalties, or patents filed, received, or pending), are the following: Pesonen declares research grants from Pfizer and Ferring, reimbursements for attending scientific meetings from Astellas and Novartis, and honoraria from Astellas and Merck. Pryalukhin declares a reimbursement for attending a scientific meeting and an honorarium from Zentiva Pharma, and travel grants from Astellas Pharma Europe and Gedeon Richter. Riikonen declares reimbursements for attending scientific meetings from Astellas and Ferring, and an honorarium from Abbvie. Tähtinen declares a reimbursement for attending a scientific meeting from Johnson & Johnson. Santti declares a reimbursement for attending a scientific meeting and an honorarium from Astellas. Vaughan was a subinvestigator on an investigator-initiated trial supported by Astellas. Johnson declares consultancy, travel reimbursements, research grants, and honoraria from Vantia and Astellas. Tammela declares consultancy for GlaxoSmithKline, Astellas, and Ferring, and an honorarium for Sanofi, and has participated in trials by Medivation, Orion Pharma, Takeda, Jansen Cilag, Lidds AB, Camurus AB, and Bayer.
Funding/Support and role of the sponsor: This study was conducted by the Clinical Urology and Epidemiology Working Group supported by the Academy of Finland (#276046), Competitive Research Funding of the Helsinki, Uusimaa Hospital District, Jane and Aatos Erkko Foundation, and Sigrid Jusélius Foundation. Pesonen was supported also by the Competitive Research Funding of the Kanta-Häme Central Hospital, and Cartwright by the UK Medical Research Council. Vaughan was supported by a US Department of Veterans Affairs Career Development Award (1 IK2 RX000747-01). The sponsors had no role in the analysis and interpretation of the data or the manuscript preparation, review, or approval.
Acknowledgments: The authors would like to thank information specialist Mervi Ahola for advice regarding literature search strategies. We would also like to thank the following researchers for checking extracted data for accuracy and/or providing additional information regarding the original studies: Yoshitaka Aoki, Akihide Hirayama, Kathleen Hunter, and Jukka Häkkinen.
Nocturia (waking from sleep at night to void) [1] is one of the most common and bothersome urinary symptoms [2]. Nocturia is associated with impaired quality of life, and is a significant cause of sleep disruption. Nocturia may increase fracture and mortality risk [3] and [4]. Cross-sectional studies suggest that older age increases the risk of nocturia [5], and studies have identified additional risk factors, suggesting a multifactorial etiology [6]. Little is known, however, about patterns of progression and remission of nocturia over time, knowledge of which would facilitate shared decision-making about the initiation and continuation of therapeutic options between patients and healthcare providers [7].
Conventional systematic reviews that compare one treatment against another or against a nontreatment control are common and the methods are well established [8]. However, systematic reviews and meta-analyses addressing natural history or prognosis of symptoms are rare, and require methodological innovation. Although investigators have conducted longitudinal studies addressing nocturia, summarizing the data is challenging, with variation between assessment tools, case definitions, and analytic strategies [6]. The primary aim of this systematic review was to explore and compare, using different analytical methods and definitions, the average annual cumulative incidence and remission of nocturia. We also aimed to examine progression of nocturia, and further develop methods for systematic reviews and meta-analyses assessing natural history and prognosis of symptoms.
We registered the review protocol (PROSPERO: CRD42012001985), and followed the Preferred Reporting Items for Systematic reviews and Meta-Analyses guidance [9]. No ethical approval was required.
An experienced research librarian (M.A.) collaborated in planning the search strategy, performed up to 31 August, 2015, in PubMed (from 1946 to present), Scopus (1995 to present), and Cumulative Index of Nursing and Allied Health Literature (1960 to present) without search limits or language restrictions. As increasing evidence suggests the benefits of inclusion of grey literature to the systematic reviews [10], we also searched abstracts published in the annual meetings of the American Urological Association, European Association of Urology, International Continence Society, and International Urogynecological Association from the past 10 yr (2005–2015) for ongoing and unpublished studies. Supplementary Appendix 1 provides the search strategy. We also hand searched reference lists of all included articles.
We included longitudinal studies with a follow-up of at least 3 mo reporting the incidence, progression, remission, or change in prevalence in a primarily non-care seeking adult population. We excluded studies in which the aim was to assess the effect of any intervention, including those with untreated control arms. We also excluded studies assessing lower urinary tract symptoms (LUTS) in patients with any specific health disorder. Finally, we excluded studies assessing the impact of pregnancy or delivery on LUTS if the baseline LUTS assessment was carried out either during pregnancy or in the 1st postpartum year.
We developed standardized, pilot-tested forms together with detailed instructions for screening of abstracts and full texts, risk of bias assessments, and data extraction. The reviewers conducted pilot screening and data extraction exercises to achieve a high level of agreement. Pairs of reviewers, independently and in duplicate, screened study reports for eligibility, assessed risk of bias, and collected data from each eligible study. Reviewers resolved disagreements through discussions; one of two adjudicators resolved remaining disagreements.
When more than one report provided data from the same study, we used the most complete report, and additionally combined data from less complete reports where possible. We recorded the country/source of study sample, age and sex distribution, exclusion criteria used in individual studies, assessment tools used for nocturia, follow-up time, sample size including response rate, as well as incidence and remission rates of nocturia.
One challenge for a systematic review of symptom prognosis is that risk of bias criteria, as well as criteria for overall certainty in estimates, although well established for reviews of therapeutic trials, are controversial in observational studies [11]. Through iterative discussion and consensus building, and informed by prior literature [12] and [13], we developed a novel instrument to categorize studies as either low or high risk of bias, evaluating the representativeness of the source populations, accuracy of the outcome assessment, and the proportion of missing data (Supplementary Appendix 2) [14].
We used three different analytic definitions to assess the incidence of nocturia: (1) any new nocturia case (≥1 voids/night) at follow-up for individuals without nocturia at baseline, (2) any new case of ≥2 voids/night for individuals with no or one void per night at baseline, and (3) any new case of ≥3 voids/night for individuals with two or less voids per night at baseline. Similarly, we used three analytic definitions for nocturia remission: (1) one or more voids per night resolving to no nocturia, (2) two or more nocturia episodes resolving to no or one void per night, and (3) three or more nocturia episodes resolving to two or less voids per night. Epidemiological studies have suggested that difference of at least one void per night is patient-important [15] and [16].
For cumulative incidence and remission rates, person-years were calculated by multiplying the number of individuals without/with nocturia (for incidence and remission, respectively) at the follow-up by follow-up time (simple cumulative incidence methodology). Standard errors and 95% confidence intervals were calculated for natural logarithms of incidence/remission rates per 1000 person-years of follow-up. In the case of zero events, a correction of 0.5 was added to observed events and person-years to enable calculation of confidence intervals. Finally, we also used actuarial cumulative incidence methodology for sensitivity analyses (Supplementary Appendix 3).
We calculated pooled rates of incidence and remission of nocturia using the DerSimonian–Laird random effects inverse variance method. Rates were expressed as observed events per 1000 person-years of follow-up. If a study provided more than one definition for incidence/remission of nocturia, when pooling data, we preferred nocturia estimates using a definition of two or more voids/night. Analyses were also carried out for three age groups (18–39 yr, 40–59 yr, and 60 yr and over) as earlier research suggest substantial differences between individuals in young adulthood, middle age, and in older age [5]. Finally, we measured estimates stratified by sex and across the three nocturia case definitions (defined as ≥1, ≥2, or ≥3 voids/night).
We employed prespecified hypotheses to examine heterogeneity using meta-regression analysis weighted by the inverse of the variance in a random effects model. Separately for each nocturia case definition (≥1, ≥2, or ≥3 voids/night), we examined the following variables as potential sources of heterogeneity: (1) mean age, (2) sex distribution, (3) length of follow-up, and (4) risk of bias. For incidence, we had prespecified hypotheses that effect estimates would be higher for: (1) older age, (2) higher proportion of male population, (3) shorter follow-up time, and (4) lower risk of bias. For remission, we had prespecified hypotheses that effect estimates would be higher for: (1) younger age, (2) higher proportion of female population, (3) shorter follow-up time, and (4) lower risk of bias.
To illustrate the relation of nocturia incidence and remission with nocturia prevalence, we estimated the (baseline) prevalence of nocturia ≥1, ≥2 and ≥3 episodes/night using a previous comprehensive systematic review addressing the prevalence of nocturia [5].
We narratively summarized the studies on progression of nocturia but did not pool estimates because too few studies on progression were included in our meta-analysis. Statistical analyzes were performed using metan and metareg in Stata 12.1 (StataCorp, College Station, TX, USA) [17].
We screened 4165 abstracts and retrieved 74 full texts and two eligible conference abstracts (Fig. 1). Sixteen studies provided usable data from 15 142 men and 18 726 women (Table 1). From these 16 studies, two provided proportional measures of progression and remission of nocturia among all persons in follow-up but did not report actual number of incident or remitting cases [18] and [19]. Similarly, one study provided only periodic prevalences of nocturia but not data of incident or remitting cases [20]. We were therefore able to include 13 studies (114 964 person-years) in meta-analyses of incidence and remission rates of nocturia [21], [22], [23], [24], [25], [26], [27], [28], [29], [30], [31], [32], and [33].
Table 1 Characteristics of the studies included in qualitative analyses
| Study | Country | Source of sample | Population characteristicsa | Exclusion criteria | Assessment tool for nocturia | Follow-up time (yr) | No. of contacted at the baseline | No. of eligible respondents | |
|---|---|---|---|---|---|---|---|---|---|
| Baseline | Follow-up | ||||||||
| Bulpitt et al 1976 [21][18] | England | GP registry | Both sex, 38% men, mean age 53 yr (range, 32–69 yr) | Hypertension | A symptom questionnaire for hypertensive patients (validated) | 0.8 | 173 | 88 (51%) | 55 (63%) |
| Lee et al 1998 [18]b | Scotland | GP registries | Men, mean age 56 yr (range, 40–79 yr) | Treatment/disease affecting lower urinary tract | AUA-SI | 5 | 3094 | 1994 (64%) | 1159 (58%) |
| Møller et al., 2000 [22] | Denmark | Civil registry | Women, mean age 50 yr (range, 40–60 yr) | None | BFLUTS | 1 | 4000 | 2860 (72%) | 2284 (80%) |
| Temml et al 2003 [19]b | Austria | Health screening | Men, mean age 55 yr (range, 40–84 yr) | Treatment affecting lower urinary tract | IPSS | 5 | 2096 | 854 (41%) | 456 (53.4%) |
| Johnson et al 2005 [23] | USA | Marketing list vendor | Both sex, 40.7% men, mean age 71yr (range, 60+ yr) | Institutionalized | MESA questionnaire (validated) | 1 | 1956 | 1632 (83%) | 1105 (68%) |
| Häkkinen et al 2006 [24] | Finland | Civil registry | Men, mean age 62 yr (range, 50–70 yr) | None | DAN-PSS | 5 | 3143 | 2198 (70%) | 1683 (77%) |
| Chen et al 2007 [25] | Taiwan | Health screening | Women, mean age 60 yr (range, 40–79 yr) | None | Unvalidated questionnaire | 2 | 1149 | 862 (75%) | 314 (36%) |
| Viktrup and Lose 2008 [26] | Denmark | Department of obstetrics | Primiparous women, mean age 35 yr (range, 17–41 yr)c | None | A questionnaire in accordance with definitions by ICS (validated) | 7 | Unclear | 305 | 226 |
| Wennberg et al 2009 [27] | Sweden | Civil registry | Women, mean age 56 yr (range, 20–98 yr) | None | IPSS | 16 | 2911 | 2248 (77%) | 1081 (37%) |
| Malmsten et al 2010 [20]b | Sweden | Civil registry | Men, mean age 62 yr (45–99 yr) | None | IPSS | 11 | 10458 | 7763 (74%) | 3257 (42%) |
| Heidler et al 2011 [28] | Austria | Health screening | Women, mean age 57 yr (range, 21–81 yr) | Urinary tract infection, surgery for urinary incontinence | BFLUTS | 6.5 | 1166 | 925 (79%) | 386 (42%) |
| Van Doorn et al 2011 [29] | The Netherlands | Civil registry | Men, mean age 62 yr (range, 50–78 yr) | Surgery/condition affecting lower urinary tract, poor health | FVC (frequency-volume chart) | 2.1 | 3398 | 1122 (33%) | 698 (62%) |
| Aoki et al 2012 [30] | Japan | Health screening | Both sex, 30.8% men, mean age 68 yr (range, 23–95 yr) | None | Unvalidated questionnaire | 4 | Unclear | 23 126 | 13 536 |
| Hunter et al 2012 [31] | USA | Home support registries | Women receiving home support, mean age 84 yr (range, 70–103 yr) | Poor health | ICIQ-FLUTS | 0.5 | 203 | 100 (49%) | 75 (75%) |
| Hirayama et al 2013 [32] | Japan | Health screening | Both sex, 50.7% men, mean age 73 yr (range, 65–93 yr) | Poor health, institutionalized | IPSS | 1 | 4427 | 3915 (88%) | 3685 (94%) |
| Araujo et al 2014 [33] | USA | Street lists | Both sex, 38.9% men, mean age 52 yr (range, 30–79 yr) | Poor health | AUA-SI | 5 | 9602 | 5502 (57%) | 4144 (75%) |
a Mean age at the midpoint of the follow-up; to estimate the mean age at the moment of nocturia incidence/remission in the study population, half of the duration of the follow-up time was added to the mean age at the baseline.
b Three studies were not included in the meta-analyses.
c Age information at the time of delivery. We used data from nocturia observations that were collected between the 7th and 12th postpartum years.AUA-SI = American Urological Association Symptom Index; BFLUTS = The Bristol Female Lower Urinary Tract Symptoms; DAN-PSS = The Danish Prostatic Symptom Score; ICIQ-FLUTS = International Consultation on Incontinence Questionnaire-Female Lower Urinary Tract Symptoms; ICS = International Continence Society; IPSS = International Prostate Symptom Score; MESA = Medical, Epidemiologic and Social Aspects of Aging questionnaire.
Table 1 provides a description of the 16 studies. Ten (62%) were conducted in Europe, three (19%) in North America, and three (19%) in Asia. The studies varied widely, including sex and age distributions, as well as in follow-up times (median 4.5 yr; range, 6 mo to 16 yr). Fifteen studies (94%) used symptom questionnaires and one (6%) used frequency-volume charts.
Of the 16 included studies, 10 (62%) were at high risk and six (38%) at low risk of bias (Fig. 2). Of these 16 studies, 14 (88%) accurately assessed nocturia both at baseline and at follow-up, nine (56%) had little missing data in the follow-up, and eight (50%) used representative source populations.
In meta-analyses of the incidence rates of nocturia (12 studies, five low and seven high risk of bias), the pooled average annual cumulative incidence was 4.9% (95% confidence interval 4.1–5.8, I2 = 98.6%; no difference between simple and actuarial cumulative incidence methodology; Fig. 3; Supplementary Fig. 1). With age stratification, annual incidence increased with increasing age: 0.4% (0–0.8%, I2 = 65.1%) for adults aged < 40 yr, 2.8% (1.9–3.7%, I2 = 98.1%) for adults aged 40–59 yr, and 11.5% (9.1–14.0%, I2 = 98.8%) for adults aged ≥ 60 yr (Fig. 3). Pooled incidence rates did not significantly differ by nocturia case definition (4.1% (3.0–5.2%) for ≥1 episode per night, 4.4% (3.6–5.2%) for ≥2 episodes per night, and 3.7% (2.4–5.1%) for ≥3 episodes per night; Supplementary Table 1).
Fig. 3 Forest plot of incidence rates of nocturia per 1000 person-years of follow-up.CI = confidence interval.
In multivariable meta-regression, (borderline) significant predictor for higher incidence was older age (4.7% increase/decade for ≥1 voids/night, –1.4 to 10.8, p = 0.12, 2.5% increase/decade for ≥2 voids/night, 0.1–4.9, p = 0.04; and 2.6% increase/decade for ≥3 voids/night, –0.2 to 5.4, p = 0.06). Follow-up time, sex distribution, or risk of bias were not strongly suggestive of higher or lower incidence of nocturia (Supplementary Table 2).
In meta-analyses of remission rates of nocturia (12 studies, five low and seven high risk of bias), the pooled average annual cumulative remission was 12.1% (9.5–14.7%, I2 = 97.8%; no difference between simple and actuarial cumulative remission methodology; Fig. 4; Supplementary Fig. 2). With age stratification, annual remission rates did not differ by age: 11.1% (3.7–18.5%, I2 = 0.0%) for adults aged < 40 yr, 9.4% (6.2–12.6%, I2 = 94.1%) for adults aged 40–59 yr, and 13.9% (9.0–18.8%, I2 = 98.8%) for adults aged ≥ 60 yr (Fig. 4). Pooled remission rates for nocturia increased with higher nocturia case definition: 6.7% (4.5–8.9%) for ≥1 voids/night, 15.5% (10.4–20.6%) for ≥2 voids/night, and 22.3% (13.2–31.3%) for ≥3 voids/night (Supplementary Table 1).
In multivariable meta-regression, age, sex distribution, follow-up time, or risk of bias were not consistently suggestive of higher or lower remission of nocturia (Supplementary Table 3).
Figure 5 illustrates the relation of baseline prevalence (of having or not having nocturia) with (average annual) cumulative incidence and remission. For instance, baseline prevalence is 5% for ≥3 nocturia episodes. Therefore, 5% of population are “at risk” of nocturia remission and 95% are “at risk” of nocturia incidence. According to our meta-analyses (Supplementary Table 1), cumulative incidence is 3.7% (2.4–5.1%) and cumulative remission is 22.3% (13.2–31.3%) for ≥3 nocturia episodes. However, due to the baseline prevalence, indeed more incident than remittent nocturia cases emerge annually and the prevalence therefore grows with age (Fig. 5).
Three studies provided proportional measures for progression/remission of nocturia [18], [19], and [28]. In a Scottish study conducted among middle-aged and elderly men [18], progression of nocturia occurred in 40% and remission in 10%, whereas in 50% of men nocturia remained unchanged after 5-yr follow-up. In an Austrian study also conducted among middle-aged and elderly men [19], progression occurred in 28%, remission in 27%, while in 45% of men nocturia symptoms were unchanged. An Austrian study conducted among women of all adult ages [28], reported after 6.5-yr follow-up, progression from one void to at least two voids per night occurred in 21% of women with one void per night at the baseline, and remission to one void per night in 23% of women with at least two voids per night at the baseline.
To our knowledge, this is the first systematic review assessing the natural history of nocturia. The strengths of this review include a contemporary and comprehensive search of both published and unpublished studies without language restrictions, the duplicate assessment of eligibility and data extraction, and the appraisal of risk of bias. Although randomized trials provide estimates of treatment effect with the lowest risk of bias, populations enrolled are likely to differ from general populations in a variety of ways, making their application to general populations limited [34]. Hence, we chose to provide estimates from observational studies of unselected patients; such studies are likely to be the best source of estimates of prognosis. We used appropriate statistical methods to generate pooled estimates, followed a prespecified data analysis plan, and employed a limited number of important and plausible hypotheses to explore potential determinants of heterogeneity, and applied novel approaches to risk of bias assessment [14]. Finally, sensitivity analyses did not change results appreciably.
The limitations of our review are largely the weaknesses of the eligible studies. Firstly, included studies use several different instruments for assessment with different definitions of nocturia. Secondly, variation in follow-up times makes comparison of estimates for incidence and remission rates of nocturia challenging because of the fluctuating nature of this symptom [35]. Pooling the rates from studies with follow-up times varying from 6 mo to 16 yr (Table 1) necessarily involves some approximation when trying to estimate average annual incidence and remission. These studies have included some people with interventions and are therefore somewhat limited as not entirely representing the “natural” history. Another important limitation is the very wide differences between rates of both incidence and remission across studies, differences that could be partially explained by age. Differences in age distributions and follow-up times between male and female studies limited the comparability of the estimates between sexes. Finally, although identified studies include both men and women of all adult ages, there is paucity of studies including younger adults.
Besides being useful in counseling patients with nocturia, these results highlight the burden of nocturia among older men and women compared with younger adults. Those aged over 60 yr were nearly four times more likely to develop nocturia compared with adults aged 40–59 yr. Also, while one out of every eight persons with nocturia reported remission annually, for clinicians and patients, nocturia remains a challenging condition to treat [6] and [36]. With the aging of populations worldwide and the well-recognized negative health impact of frequent nocturia [15] and [37], development of novel treatment strategies that are well-tolerated should remain a research priority.
Our study summarizes the incidence and remission of nocturia in a general population using data from five low and eight high risk of bias studies. Across all available studies, the incidence of nocturia is 0.4% per year among adults aged < 40 yr, 2.8% among those aged 40–59 yr, and 11.5% among those aged ≥ 60 yr, while overall remission is 12.1% per year; estimates, however, varied considerably among studies. These estimates can aid with management decisions and counseling related to nocturia.
Author contributions: Kari A.O. Tikkinen had full access to all the data in the study and takes responsibility for the integrity of the data and the accuracy of the data analysis.
Study concept and design: Pesonen, Cartwright, Tikkinen.
Acquisition of data: Pesonen, Cartwright, Mangera, Santti, Griebling, Pryalukhin, Riikonen, Tähtinen, Agarwal, Tsui, Vaughan, Markland, Johnson, Fonsell-Annala, Khoo, Aoki, Tikkinen.
Analysis and interpretation of data: Pesonen, Cartwright, Auvinen, Heels-Ansdell, Guyatt, Tikkinen.
Drafting of the manuscript: Pesonen, Cartwright, Tikkinen.
Critical revision of the manuscript for important intellectual content: Pesonen, Cartwright, Mangera, Santti, Griebling, Pryalukhin, Riikonen, Tähtinen, Agarwal, Tsui, Vaughan, Markland, Johnson, Fonsell-Annala, Khoo, Tammela, Aoki, Auvinen, Heels-Ansdell, Guyatt, Tikkinen.
Statistical analysis: Pesonen, Cartwright, Heels-Ansdell, Guyatt, Tikkinen.
Obtaining funding: Tikkinen.
Administrative, technical, or material support: Tammela.
Supervision: Cartwright, Guyatt, Tikkinen.
Other: None.
Financial disclosures: Kari A.O. Tikkinen certifies that all conflicts of interest, including specific financial interests and relationships and affiliations relevant to the subject matter or materials discussed in the manuscript (eg, employment/affiliation, grants or funding, consultancies, honoraria, stock ownership or options, expert testimony, royalties, or patents filed, received, or pending), are the following: Pesonen declares research grants from Pfizer and Ferring, reimbursements for attending scientific meetings from Astellas and Novartis, and honoraria from Astellas and Merck. Pryalukhin declares a reimbursement for attending a scientific meeting and an honorarium from Zentiva Pharma, and travel grants from Astellas Pharma Europe and Gedeon Richter. Riikonen declares reimbursements for attending scientific meetings from Astellas and Ferring, and an honorarium from Abbvie. Tähtinen declares a reimbursement for attending a scientific meeting from Johnson & Johnson. Santti declares a reimbursement for attending a scientific meeting and an honorarium from Astellas. Vaughan was a subinvestigator on an investigator-initiated trial supported by Astellas. Johnson declares consultancy, travel reimbursements, research grants, and honoraria from Vantia and Astellas. Tammela declares consultancy for GlaxoSmithKline, Astellas, and Ferring, and an honorarium for Sanofi, and has participated in trials by Medivation, Orion Pharma, Takeda, Jansen Cilag, Lidds AB, Camurus AB, and Bayer.
Funding/Support and role of the sponsor: This study was conducted by the Clinical Urology and Epidemiology Working Group supported by the Academy of Finland (#276046), Competitive Research Funding of the Helsinki, Uusimaa Hospital District, Jane and Aatos Erkko Foundation, and Sigrid Jusélius Foundation. Pesonen was supported also by the Competitive Research Funding of the Kanta-Häme Central Hospital, and Cartwright by the UK Medical Research Council. Vaughan was supported by a US Department of Veterans Affairs Career Development Award (1 IK2 RX000747-01). The sponsors had no role in the analysis and interpretation of the data or the manuscript preparation, review, or approval.
Acknowledgments: The authors would like to thank information specialist Mervi Ahola for advice regarding literature search strategies. We would also like to thank the following researchers for checking extracted data for accuracy and/or providing additional information regarding the original studies: Yoshitaka Aoki, Akihide Hirayama, Kathleen Hunter, and Jukka Häkkinen.