Hypothesis / aims of study
Uroflowmetry is a noninvasive and relatively inexpensive test. Therefore, it is an indispensable, first-line screening test for most patients with suspected lower urinary tract dysfunction. It provides objective and quantitative information to understand both storage and voiding symptoms. The parameters classically analyzed are: maximum flow rate (Qmax), flow time, average flow rate, time to maximum urine flow, voided volume, and post-void residual urine volume. Although the shape of the flow curve may suggest specific types of abnormality, reliable information about the underlying dysfunction of the abnormal voiding cannot be derived from a flow curve alone.
Bladder outlet obstruction (BOO) due to Benign Prostate Hyperplasia is the most common condition causing male LUTS (MLUTS). However, not only BOO, but also detrusor underactivity (DU), is a common cause of MLUTS and has been reported to be present in 9-48% of men undergoing urodynamic evaluation for LUTS. Currently, only when flow signal is combined with intravesical and abdominal pressure recordings does it become possible, from the pressure-flow relationship, to analyze separately the contributions of detrusor contraction and bladder outlet function to the overall voiding pattern.
The aim of the present study is to create a classification algorithm capable of objectively distinguishing BOO and DU from uroflowmetry patterns in male patients. Accessible and correct identification of the underlying dysfunction might spare patients invasive pressure/flow tests and could contribute to the cost-effectiveness of the clinical diagnosis process.
Study design, materials and methods
Study design and patient population
We performed a retrospective, observational, analytic and unicentric study. We included 124 male patients with voiding MLUTS subjected to urodynamic study, from 2012 to 2021. 62 consecutive patients with a urodynamic diagnosis of DU were selected as well as 62 patients with BOO. We excluded patients with undetermined results on the pressure/flow study (PFS), multiple urodynamic diagnosis, unavailable clinical data, or unacceptable uroflowmetry quality following the ICS standards. Urodynamic data was extracted from the institution’s urodynamics database. Electronical medical records of included patients were reviewed.
This study was conducted in accordance with the ethical standards of the Declaration of Helsinki and was approved by the ethical committee of our institution.
Urodynamic examination
The diagnosis was established through PFS, which was performed in accordance with the ICS Good Urodynamics Practices protocol. Following ICS recommendations, Bladder contractility index (BCI = detrusor pressure at maximum flow (PdetQmax) + 5Qmax) and BOO index (BOOI = PdetQmax − 2 Qmax) were analyzed. DU was defined as BCI <100 and BOOI 100 and BOOI >40.
Free uroflowmetry was done the same day that PFS was performed. The free uroflowmetry signal was registered with a 10 observations per second ratio, and the patterns analyzed were up to 2-minutes long, resulting in up to 1200 flow measurement observations for every uroflowmetry chart. The precision of the measurements was 0,1ml/s. All the measurements were done with MMS equipment (Solar system®) and software (MMS v 8.17I, 2010).
Statistical analysis and algorithm creation
Uroflowmetry signal was normalized using spline and trace segmentation techniques. The signal was processed using FFT and Wavelets to extract the relevant characteristics. After signal processing, multiple classification algorithms have been tested: MLP, Logistic Regression, PLS, Random Forest and Support vector machine. Global and local approaches have been used. The evaluation and internal validation of the models have been performed using the Leaving one out (LOO) technique.
Demographic and urodynamic data are expressed as mean and standard deviation. Receiver operating characteristic (ROC) curve analysis was performed to identify optimal cutoff values. Statistical analyses were performed using R statistical software (version R 4.0.0; R Foundation for Statistical Computing).
Results
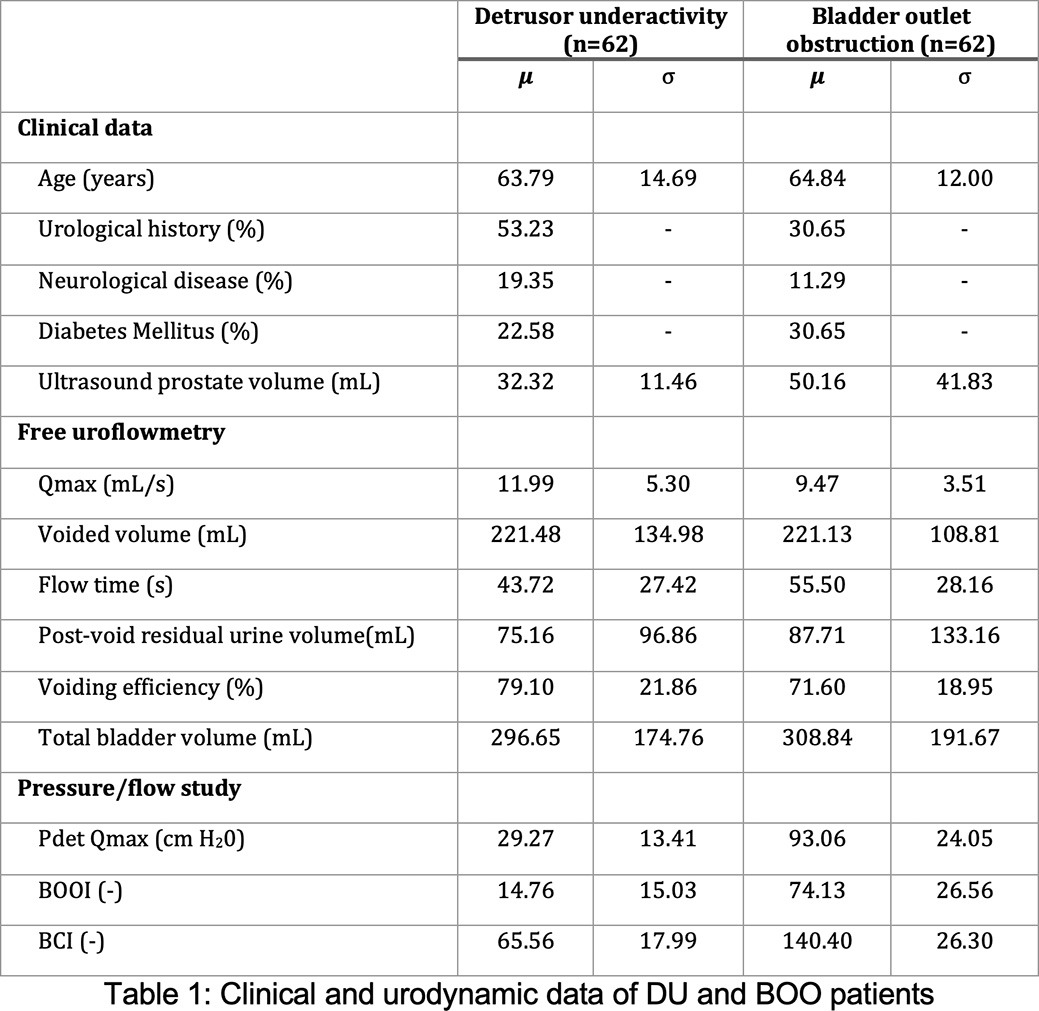
Of the 124 men included in this study, 62 were assigned to the DU group and 62 to the BOO group. Clinical characteristics of the DU and BOO population are shown in figure 1. The age is comparable between groups. The presence of previous urological history was higher in the DU group. Urological history includes TURP, Radical prostatectomy and urethroplasty among other surgical procedures in the lower urinary tract. The prevalence of neurological pathology was higher in the DU group and diabetes was more prevalent in the BOO group. Prostate volume was higher for the BOO group.
Free uroflowmetry and PFS data are represented in table 1. Qmax and voiding efficiency were higher for the DU group. PdetQmax, BOOI and BCI were substantially higher for the BOO group.
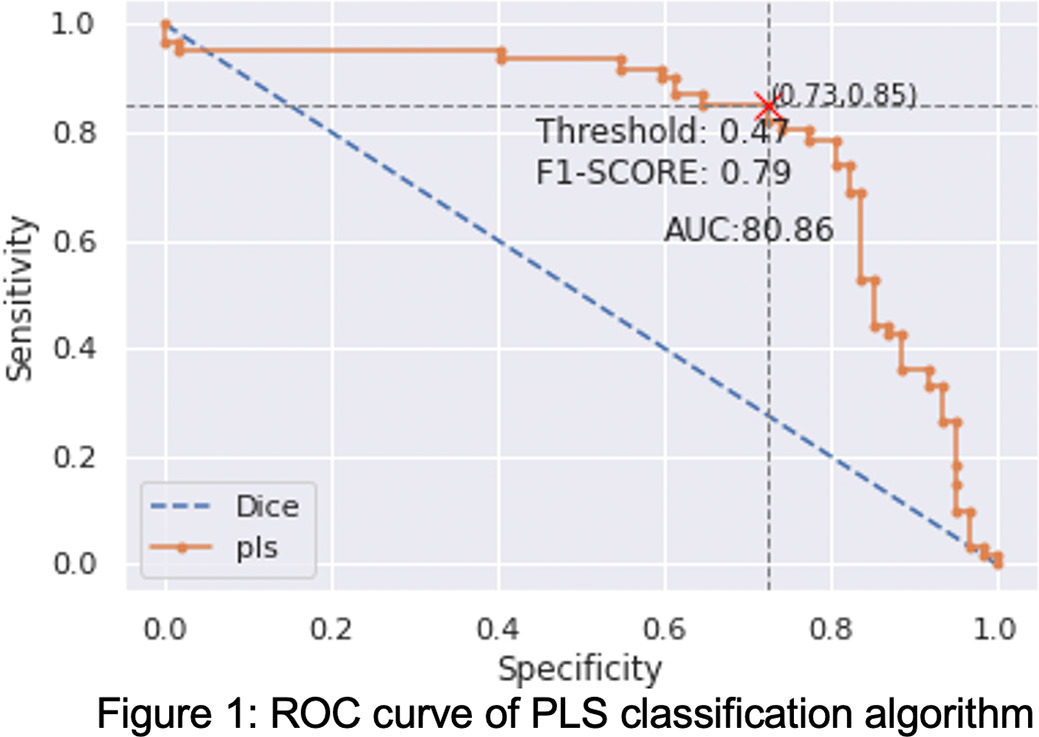
The best performance for the study was obtained through a PLS classification algorithm. The application of this model to the sample using a LOO validation technique resulted in a ROC AUC of 0.8081. The sensitivity and the specificity for the UD group are 0,85 and 0,73, respectively. ROC curve is shown in Figure 1.
Interpretation of results
Despite the reasonable differences found between groups regarding Qmax and voiding efficiency, standard uroflowmetry parameters were comparable for both groups. Differences found in PFS results were expected, due to the prior classification of the patients based on such parameters.
Uroflowmetry is a noninvasive and relatively inexpensive test. In the last decade multiple attempts to find objective tools to analyze uroflowmetry outputs have been made. For distinguishing BOO and DU, Lee et al (1) created a parameter called DeltaQ, based on preexisting parameters (Qmax and Qave). Matsukawa et al (2) and Wada et al (3) postulated that sawtooth and interrupted waveform could be a predictor for DU. Although an interesting approach, depending on a certain pattern could restrict the applications of the analysis. The mentioned studies obtained AUC similar to the present study.
A machine-learning (ML) based algorithm was created and validated that can objectively differentiate between with BOO and DU. No specific pattern has been selected and all points on the flow curve have been considered. The probability of DU can be calculated by this algorithm, based on free uroflowmetry curve. This tool could help clinicians to decide whether to perform urodynamics and to reassure a surgical approach in case of a BOO result.
For this study, the AUC was obtained exclusively from the analysis of the flow signal. This could open the possibility of compiling data directly from the urodynamic devices on a much bigger scale. On the other hand, the incorporation of the clinical data to the algorithm could boost its performance, although it could reduce its clinical practicality and limit the data management.
Our study has numerous limitations. We were not able to calculate the necessary due to the exploratory character of our study, and the sample size in the present study is low. In this direction, we would like to highlight that the aim of the present study was to show that free uroflowmetry patterns can be computationally analyzed instead of qualitatively assessed by urologists. We intend to pursue further research with larger sample sizes. Also, we divided patients into two groups, BOO and DU, regardless of the common coexistence of these two pathologies. Patients with USD and healthy patients were not included. Finally, it lacks external validation with a prospective population.
Concluding message
ML-based uroflowmetry pattern analysis may provide some help to distinguish between BOO and DU in MLUTS patients. Prospective and multicentric studies should be conducted to validate the results and maximize the algorithm training.
References